

Measuring transcription factor-binding site turnover: a maximum likelihood approach using phylogenies
- PMID: 20333180
- PMCID: PMC2817405
- DOI: 10.1093/gbe/evp010
Measuring transcription factor-binding site turnover: a maximum likelihood approach using phylogenies
Abstract
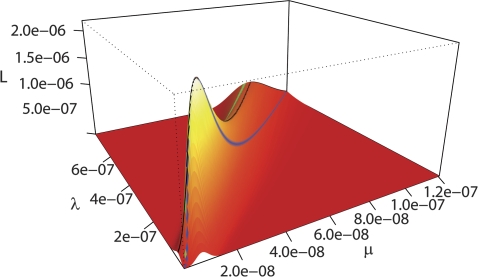
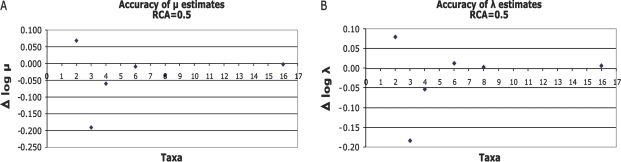
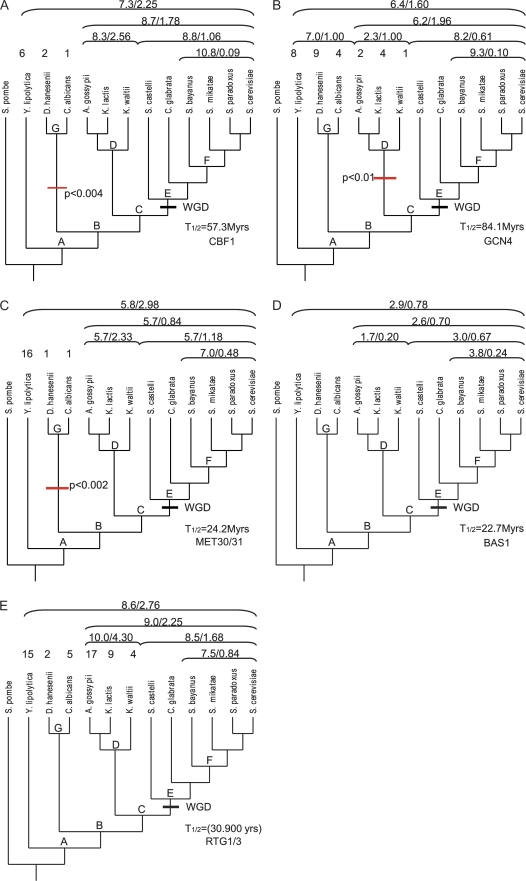
A major mode of gene expression evolution is based on changes in cis-regulatory elements (CREs) whose function critically depends on the presence of transcription factor-binding sites (TFBS). Because CREs experience extensive TFBS turnover even with conserved function, alignment-based studies of CRE sequence evolution are limited to very closely related species. Here, we propose an alternative approach based on a stochastic model of TFBS turnover. We implemented a maximum likelihood model that permits variable turnover rates in different parts of the species tree. This model can be used to detect changes in turnover rate as a proxy for differences in the selective pressures acting on TFBS in different clades. We applied this method to five TFBS in the fungi methionine biosynthesis pathway and three TFBS in the HoxA clusters of vertebrates. We find that the estimated turnover rate is generally high, with half-life ranging between approximately 5 and 150 My and a mode around tens of millions of years. This rate is consistent with the finding that even functionally conserved enhancers can show very low sequence similarity. We also detect statistically significant differences in the equilibrium densities of estrogen- and progesterone-response elements in the HoxA clusters between mammal and nonmammal vertebrates. Even more extreme clade-specific differences were found in the fungal data. We conclude that stochastic models of TFBS turnover enable the detection of shifts in the selective pressures acting on CREs in different organisms. The analysis tool, called CRETO (Cis-Regulatory Element Turn-Over) can be downloaded from http://www.bioinf.uni-leipzig.de/Software/creto/.
Keywords: cis-regulatory evolution; enhancer evolution; evolution of development; evolution of gene regulation; noncoding sequences; promoter evolution.
Figures


Similar articles
-
Phylogenetic simulation of promoter evolution: estimation and modeling of binding site turnover events and assessment of their impact on alignment tools.Genome Biol. 2007;8(10):R225. doi: 10.1186/gb-2007-8-10-r225. Genome Biol. 2007. PMID: 17956628 Free PMC article.
-
A stochastic model for the evolution of transcription factor binding site abundance.J Theor Biol. 2007 Aug 7;247(3):544-53. doi: 10.1016/j.jtbi.2007.03.001. Epub 2007 Mar 7. J Theor Biol. 2007. PMID: 17475285
-
Favorable genomic environments for cis-regulatory evolution: A novel theoretical framework.Semin Cell Dev Biol. 2016 Sep;57:2-10. doi: 10.1016/j.semcdb.2015.12.003. Epub 2015 Dec 8. Semin Cell Dev Biol. 2016. PMID: 26673387 Review.
-
Incorporating evolution of transcription factor binding sites into annotated alignments.J Biosci. 2007 Aug;32(5):841-50. doi: 10.1007/s12038-007-0084-2. J Biosci. 2007. PMID: 17914226
-
Comparative genomics of gene regulation-conservation and divergence of cis-regulatory information.Curr Opin Genet Dev. 2009 Dec;19(6):565-70. doi: 10.1016/j.gde.2009.10.006. Epub 2009 Nov 11. Curr Opin Genet Dev. 2009. PMID: 19913403 Review.
Cited by
-
Use of ChIP-Seq data for the design of a multiple promoter-alignment method.Nucleic Acids Res. 2012 Apr;40(7):e52. doi: 10.1093/nar/gkr1292. Epub 2012 Jan 9. Nucleic Acids Res. 2012. PMID: 22230796 Free PMC article.
-
Is transcription factor binding site turnover a sufficient explanation for cis-regulatory sequence divergence?Genome Biol Evol. 2010;2:851-8. doi: 10.1093/gbe/evq066. Epub 2010 Nov 10. Genome Biol Evol. 2010. PMID: 21068212 Free PMC article.
-
The relativity of biological function.Theory Biosci. 2015 Dec;134(3-4):143-7. doi: 10.1007/s12064-015-0215-5. Epub 2015 Oct 8. Theory Biosci. 2015. PMID: 26449352
-
Intersecting transcription networks constrain gene regulatory evolution.Nature. 2015 Jul 16;523(7560):361-5. doi: 10.1038/nature14613. Epub 2015 Jul 8. Nature. 2015. PMID: 26153861 Free PMC article.
-
TFforge utilizes large-scale binding site divergence to identify transcriptional regulators involved in phenotypic differences.Nucleic Acids Res. 2019 Feb 28;47(4):e19. doi: 10.1093/nar/gky1200. Nucleic Acids Res. 2019. PMID: 30496469 Free PMC article.
References
-
- Akbas GE, Song J, Taylor HS. A HOXA10 estrogen response element (ERE) is differentially regulated by 17 beta-estradiol and diethylstilbestrol (DES) J Mol Biol. 2004;340(5):1013–1023. - PubMed
-
- Bourdeau V, et al. Genome-wide identification of high-affinity estrogen response elements in human and mouse. Mol Endocrinol. 2004;18(6):1411–1427. - PubMed
