. 2009 May 27:1:131-44.
doi: 10.1093/gbe/evp013.

Similarly strong purifying selection acts on human disease genes of all evolutionary ages

Affiliations

Similarly strong purifying selection acts on human disease genes of all evolutionary ages

James J Cai et al. Genome Biol Evol. .

Abstract

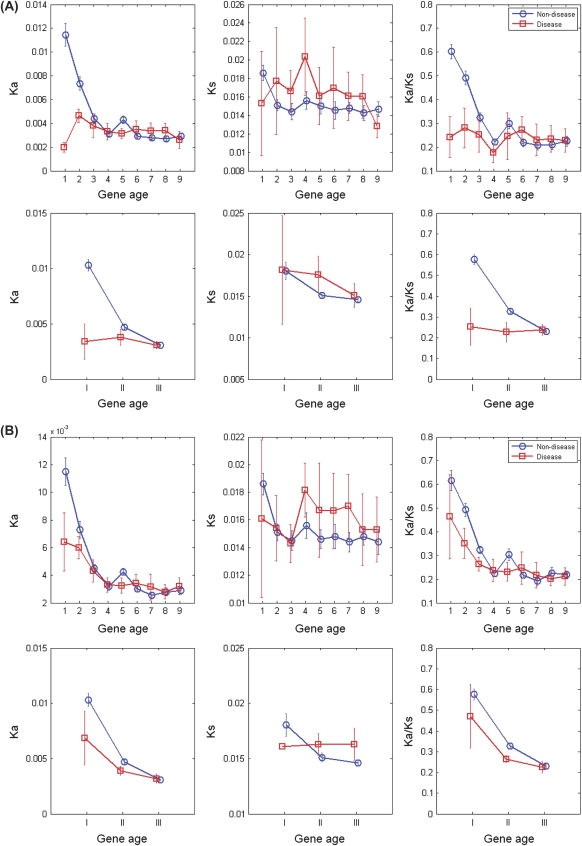
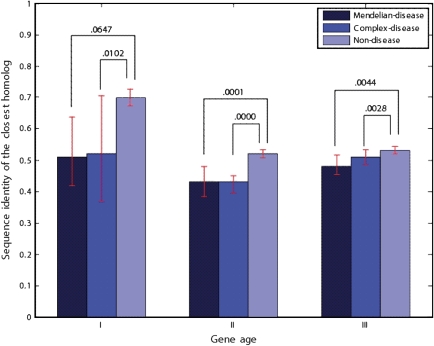
A number of studies have showed that recently created genes differ from the genes created in deep evolutionary past in many aspects. Here, we determined the age of emergence and propensity for gene loss (PGL) of all human protein-coding genes and compared disease genes with non-disease genes in terms of their evolutionary rate, strength of purifying selection, mRNA expression, and genetic redundancy. The older and the less prone to loss, non-disease genes have been evolving 1.5- to 3-fold slower between humans and chimps than young non-disease genes, whereas Mendelian disease genes have been evolving very slowly regardless of their ages and PGL. Complex disease genes showed an intermediate pattern. Disease genes also have higher mRNA expression heterogeneity across multiple tissues than non-disease genes regardless of age and PGL. Young and middle-aged disease genes have fewer similar paralogs as non-disease genes of the same age. We reasoned that genes were more likely to be involved in human disease if they were under a strong functional constraint, expressed heterogeneously across tissues, and lacked genetic redundancy. Young human genes that have been evolving under strong constraint between humans and chimps might also be enriched for genes that encode important primate or even human-specific functions.

Keywords: evolutionary age of genes; human disease genes; propensity for gene loss; strength of selection.


Figures

F<sc>IG</sc>. 1.—
FIG. 1.—
Using phylogenetic profile to define the age of genes. The left part illustrated the phylogeny of 18 eukaryotic species (including human) or lineages. The numbers following the species names are the order of 39 species given by PhyloPat (the higher the order, the closer is this species to human). Multiple species, which appeared after their common ancestor separated from the human lineage, were collapsed into one lineage (bolded). The expanded phylogeny of all 39 species is given in supplementary fig. S1 (Supplementary Material online). The right panel illustrates the phylogenetic profiles for 16,727 human genes used in this study. The panel contains 16727 × 18 cells. Each cell indicates the presence (in black) or absence (in yellow) of ortholog of the gene in the species/lineage. Here, for illustrative purpose, genes are sorted by the alphabetic order of their string representations of phylogenetic profile. Vertical red lines split genes into nine equally populated bins.
F<sc>IG</sc>. 2.—
FIG. 2.—
Frequencies of Mendelian disease genes (A) and complex disease genes (B) as functions of their age. Genes are partitioned into nine equally populated bins as well as (I) young-, (II) middle-, and (III) old-aged groups (Materials and Methods). The error bars represent the 95% binomial proportion confidence intervals.
F<sc>IG</sc>. 3.—
FIG. 3.—
Ka, Ks, and Ka/Ks as functions of the age of genes. Mendelian disease genes (A) and complex disease genes (B) are partitioned into one–nine equally populated bins as well as (I) young-, (II) middle-, and (III) old-aged groups. Median values and 95% confidence intervals are given for disease genes (red square) and non-disease genes (blue circle).
F<sc>IG</sc>. 4.—
FIG. 4.—
Mean expression level (aveExp), expression heterogeneity (hetExp), and peak expression level (maxExp) as functions of the age of genes. Mendelian disease genes (A) and complex disease genes (b) are partitioned into one to nine equally populated bins as well as (I) young-, (II) middle-, and (III) old-aged groups. Median values and 95% confidence intervals are given for disease genes (red square) and non-disease genes (blue circle).
F<sc>IG</sc>. 5.—
FIG. 5.—
Sequence identify of the closest homolog of genes. Mendelian, complex, and non-disease genes are partitioned into (I) young-, (II) middle-, and (III) old-aged groups. Median values and 95% confidence intervals are plotted. P values of KS tests between groups are given.

References

    1. Adie EA, Adams RR, Evans KL, Porteous DJ, Pickard BS. Speeding disease gene discovery by sequence based candidate prioritization. BMC Bioinformatics. 2005;6:55. - PMC - PubMed
    1. Alba MM, Castresana J. Inverse relationship between evolutionary rate and age of mammalian genes. Mol Biol Evol. 2005;22:598–606. - PubMed
    1. Alba MM, Castresana J. On homology searches by protein Blast and the characterization of the age of genes. BMC Evol Biol. 2007;7:53. - PMC - PubMed
    1. Al-Shahrour F, Diaz-Uriarte R, Dopazo J. FatiGO: a web tool for finding significant associations of Gene Ontology terms with groups of genes. Bioinformatics. 2004;20:578–580. - PubMed
    1. Babushok DV, Ostertag EM, Kazazian HH., Jr Current topics in genome evolution: molecular mechanisms of new gene formation. Cell Mol Life Sci. 2007;64:542–554. - PMC - PubMed