. 2009 Jul 14:1:239-57.
doi: 10.1093/gbe/evp019.

Genome sequence and comparative genome analysis of Lactobacillus casei: insights into their niche-associated evolution

Affiliations

Genome sequence and comparative genome analysis of Lactobacillus casei: insights into their niche-associated evolution

Hui Cai et al. Genome Biol Evol. .

Abstract

Lactobacillus casei is remarkably adaptable to diverse habitats and widely used in the food industry. To reveal the genomic features that contribute to its broad ecological adaptability and examine the evolution of the species, the genome sequence of L. casei ATCC 334 is analyzed and compared with other sequenced lactobacilli. This analysis reveals that ATCC 334 contains a high number of coding sequences involved in carbohydrate utilization and transcriptional regulation, reflecting its requirement for dealing with diverse environmental conditions. A comparison of the genome sequences of ATCC 334 to L. casei BL23 reveals 12 and 19 genomic islands, respectively. For a broader assessment of the genetic variability within L. casei, gene content of 21 L. casei strains isolated from various habitats (cheeses, n = 7; plant materials, n = 8; and human sources, n = 6) was examined by comparative genome hybridization with an ATCC 334-based microarray. This analysis resulted in identification of 25 hypervariable regions. One of these regions contains an overrepresentation of genes involved in carbohydrate utilization and transcriptional regulation and was thus proposed as a lifestyle adaptation island. Differences in L. casei genome inventory reveal both gene gain and gene decay. Gene gain, via acquisition of genomic islands, likely confers a fitness benefit in specific habitats. Gene decay, that is, loss of unnecessary ancestral traits, is observed in the cheese isolates and likely results in enhanced fitness in the dairy niche. This study gives the first picture of the stable versus variable regions in L. casei and provides valuable insights into evolution, lifestyle adaptation, and metabolic diversity of L. casei.

Keywords: comparative genome hybridization; evolution; niche adaptation.


Figures

F<sc>IG</sc>. 1.—
FIG. 1.—
Genome atlas of L. casei ATCC 334. The color coding of the genomic features in circle 1 represents different COG categories. Locations of CRISPR, phage 1 (Lca1) and phage 2 (phage remnant), the lifestyle adaptation island, and hypervariable regions are labeled.
F<sc>IG</sc>. 2.—
FIG. 2.—
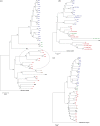
Minimum evolution phylogenetic trees for (a) concatenated alignment of four subunits (α, β, β′, and δ) of the RNA polymerase, (b) lactocepin, (c) PepN, (d) PepX, (e) PepC/E, and (f) PepO from 45 LAB strains. Bacillus and Bifidobacteria are used as outgroups. Bootstrap values on the bifurcating branches are based on 1,000 random bootstrap replicates for the consensus tree. Strains that contain both PepC and PepE are circled in the RNA polymerase tree (a). Strains representing different genera are color coded; Lactobacillus is shown in red, Streptococcus in blue, Lactococcus in green, Leuconostoc in brown, and the rest (Oenococcus, Enterococcus, and Pediococcus) in black. Gene ID is given for strains with more than one homolog. Strain code: efa, Enterococcus faecalis V583; lac, L. acidophilus NCFM; lbr, L. brevis ATCC 367; lca, L. casei ATCC 334; lcb, L. casei BL23; ldb, L. delbrueckii ATCC 11842; lbu, L. delbrueckii ATCC BAA-365; lfe, L. fermentum IFO3956; lga, L. gasseri ATCC 33323; lhe, L. helveticus DPC 4571; ljo, L. johnsonii NCC 533; lpl, L. plantarum WCFS1; lre, L. reuteri DSM 20016; lrf, L. reuteri JCM 1112; lrh, L. rhamnosus HN001; lsa, L. sakei subsp. sakei 23K; lsl, L. salivarius UCC118; llm, L. lactis subsp. cremoris MG1363; llc, L. lactis subsp. cremoris SK11; lla, L. lactis subsp. lactis IL1403; lci, Leuconostoc citreum KM20; lme, L. mesenteroides subsp. mesenteroides ATCC 8293; ooe, Oenococcus oeni PSU-1; ppe, P. pentosaceus ATCC 25745; sag, Streptococcus agalactiae 2603 (serotype V); sak, S. agalactiae A909 (serotype Ia); san, S. agalactiae NEM316 (serotype III); seu, Streptococcus equi subsp. equi 4047; seq, Streptococcus equi subsp. zooepidemicus; sez, S. equi subsp. zooepidemicus MGCS10565; sgo, Streptococcus gordonii str. Challis substr. CH1; smu, Streptococcus mutans UA159; spd, Streptococcus pneumoniae D39; spr, S. pneumoniae R6; spn, S. pneumoniae TIGR4; spz, Streptococcus pyogenes MGAS5005 (serotype M1); spm, S. pyogenes MGAS8232 (serotype M18); spy, S. pyogenes SF370 (serotype M1); ssa, Streptococcus sanguinis SK36; ssu, Streptococcus suis 05ZYH33; ssv, S. suis 98HAH33; stc, S. thermophilus CNRZ1066; ste, S. thermophilus LMD-9; stl, S. thermophilus LMG18311; and sub, Streptococcus uberis 0140J.
F<sc>IG</sc>. 3.—
FIG. 3.—
Genome comparison between L. casei strains ATCC 334 (top) and BL23 (bottom). GIs of more than 5 kb in each genome are numbered. Homologous genomic sequences (BlastN matches) are indicated by red (same orientation) and blue (inversion) lines between the chromosomes.
F<sc>IG</sc>. 4.—
FIG. 4.—
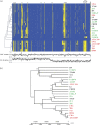
Analysis of genome diversity in L. casei by CGH and MLST. Panel (a) shows CGH composite view of genome diversity among 22 L. casei strains isolated from cheeses (red), human sources (black), and plant materials (green). Each row shows the results for one strain, and each column represents the CDS along the ATCC 334 genome, starting at the origin of replication and proceeding clockwise. Blue and yellow areas denote the presence and absence of coding sequences, respectively. Location of the 12 GIs of ATCC 334 (top), the putative lifestyle adaptation island (top, large triangle square), the pLSEI1 (top, small triangle square), the GC %, and GC deviation (bottom) are labeled. Panel (b) gives the MLST dendrogram for genetic relatedness among the same L. casei strains. The bottom scale shows the divergence time frame and the number of synonymous substitutions per nucleotide site. Bootstrap values on bifurcating branches are based on 1,000 random bootstrap replicates for the consensus tree.
F<sc>IG</sc>. 5.—
FIG. 5.—
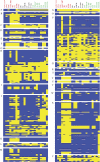
Patterns of presence (blue) or absence (yellow) in 25 hypervariable regions of 22 L. casei strains isolated from cheeses (red), human sources (black), and plant materials (green). Each row represents a gene, each panel represents a hypervariable region, and each column corresponds to a L. casei strain designated vertically across the bottom.
F<sc>IG</sc>. 6.—
FIG. 6.—
Model of evolution of L. casei from an ancestral Lactobacillus. Evolution is achieved by both gene gain and gene loss.

References

    1. Abbott JC, Aanensen DM, Rutherford K, Butcher S, Spratt BG. WebACT—an online companion for the Artemis Comparison Tool. Bioinformatics. 2005;21:3665–3666. - PubMed
    1. Acedo-Felix E, Perez-Martinez G. Significant differences between Lactobacillus casei subsp. casei ATCC 393T and a commonly used plasmid-cured derivative revealed by a polyphasic study. Int J Syst Evol Microbiol. 2003;53:67–75. - PubMed
    1. Altermann E, et al. Complete genome sequence of the probiotic lactic acid bacterium Lactobacillus acidophilus NCFM. Proc Natl Acad Sci USA. 2005;102:3906–3912. - PMC - PubMed
    1. Axelsson L. Lactic acid bacteria: classification and physiology. In: Salminen S, von Wright A, Ouwehand A, editors. Lactic acid bacteria microbiological and functional aspects. 3rd edition. New York: Marcel Dekker Inc; 2004. pp. 1–66.
    1. Azcarate-Peril MA, et al. Analysis of the genome sequence of Lactobacillus gasseri ATCC 33323 reveals the molecular basis of an autochthonous intestinal organism. Appl Environ Microbiol. 2008;74:4610–4625. - PMC - PubMed