

High-resolution mapping of evolutionary trajectories in a phage
- PMID: 20333199
- PMCID: PMC2817424
- DOI: 10.1093/gbe/evp029
High-resolution mapping of evolutionary trajectories in a phage
Abstract
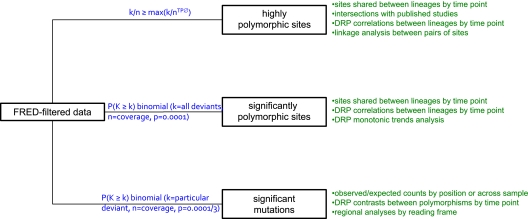
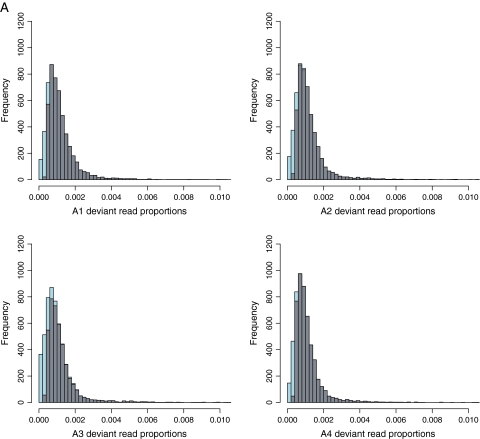
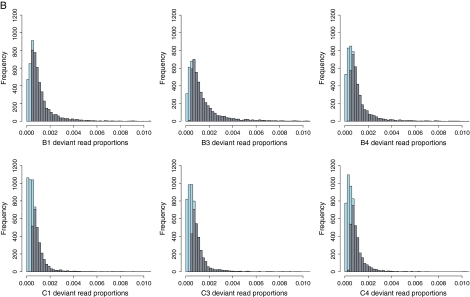
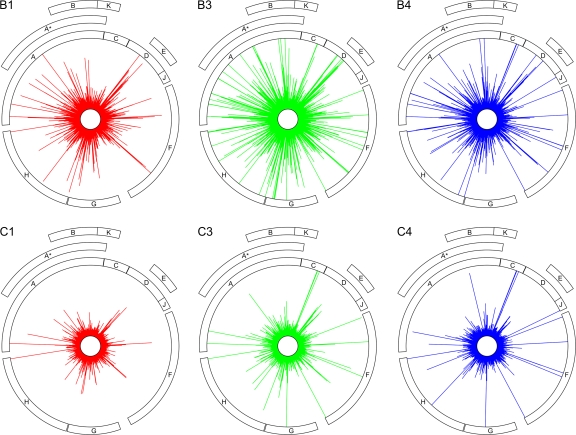
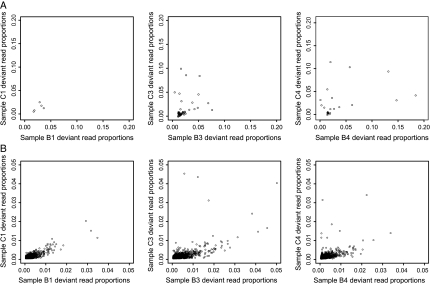
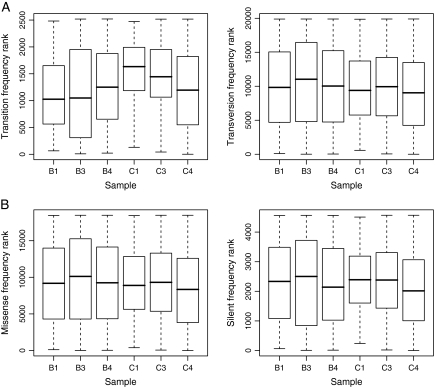
Experimental evolution in rapidly reproducing viruses offers a robust means to infer substitution trajectories during evolution. But with conventional approaches, this inference is limited by how many individual genotypes can be sampled from the population at a time. Low-frequency changes are difficult to detect, potentially rendering early stages of adaptation unobservable. Here we circumvent this using short-read sequencing technology in a fine-grained analysis of polymorphism dynamics in the sentinel organism: a single-stranded DNA phage PhiX174. Nucleotide differences were educed from noise with binomial filtering methods that harnessed quality scores and separate data from brief phage amplifications. Remarkably, a significant degree of variation was observed in all samples including those grown in brief 2-h cultures. Sites previously reported as subject to high-frequency polymorphisms over a course of weeks exhibited monotonic increases in polymorphism frequency within hours in this study. Additionally, even with limitations imposed by the short length of sequencing reads, we were able to observe statistically significant linkage among polymorphic sites in evolved lineages. Additional parallels between replicate lineages were apparent in the sharing of polymorphic sites and in correlated polymorphism frequencies. Missense mutations were more likely to occur than silent mutations. This study offers the first glimpse into "real-time" substitution dynamics and offers a robust conceptual framework for future viral resequencing studies.
Keywords: experimental evolution; next-generation sequencing; substitution analysis.
Figures
Similar articles
-
Profiles of adaptation in two similar viruses.Genetics. 2001 Dec;159(4):1393-404. doi: 10.1093/genetics/159.4.1393. Genetics. 2001. PMID: 11779783 Free PMC article.
-
Time-Sampled Population Sequencing Reveals the Interplay of Selection and Genetic Drift in Experimental Evolution of Potato Virus Y.J Virol. 2017 Jul 27;91(16):e00690-17. doi: 10.1128/JVI.00690-17. Print 2017 Aug 15. J Virol. 2017. PMID: 28592544 Free PMC article.
-
VirION2: a short- and long-read sequencing and informatics workflow to study the genomic diversity of viruses in nature.PeerJ. 2021 Mar 30;9:e11088. doi: 10.7717/peerj.11088. eCollection 2021. PeerJ. 2021. PMID: 33850654 Free PMC article.
-
QTL mapping using high-throughput sequencing.Methods Mol Biol. 2015;1284:257-85. doi: 10.1007/978-1-4939-2444-8_13. Methods Mol Biol. 2015. PMID: 25757777 Review.
-
Exploring the hepatitis C virus genome using single molecule real-time sequencing.World J Gastroenterol. 2019 Aug 28;25(32):4661-4672. doi: 10.3748/wjg.v25.i32.4661. World J Gastroenterol. 2019. PMID: 31528092 Free PMC article. Review.
Cited by
-
Selection affects genes involved in replication during long-term evolution in experimental populations of the bacteriophage φX174.PLoS One. 2013;8(3):e60401. doi: 10.1371/journal.pone.0060401. Epub 2013 Mar 22. PLoS One. 2013. PMID: 23533679 Free PMC article.
-
Next Generation Sequencing Approaches to Characterize the Respiratory Tract Virome.Microorganisms. 2022 Nov 24;10(12):2327. doi: 10.3390/microorganisms10122327. Microorganisms. 2022. PMID: 36557580 Free PMC article. Review.
-
Polymorphisms in SHISA3 and RFC3 genes and their association with feed conversion ratio in Hu sheep.Front Vet Sci. 2023 Jan 5;9:1010045. doi: 10.3389/fvets.2022.1010045. eCollection 2022. Front Vet Sci. 2023. PMID: 36686193 Free PMC article.
-
Dynamics of mitochondrial heteroplasmy in three families investigated via a repeatable re-sequencing study.Genome Biol. 2011;12(6):R59. doi: 10.1186/gb-2011-12-6-r59. Epub 2011 Jun 23. Genome Biol. 2011. PMID: 21699709 Free PMC article.
-
Replaying the tape of life: quantification of the predictability of evolution.Front Genet. 2012 Nov 26;3:246. doi: 10.3389/fgene.2012.00246. eCollection 2012. Front Genet. 2012. PMID: 23226153 Free PMC article.
References
-
- Broberg P. 2008. SAGx: statistical Analysis of the GeneChip. R package version 1.16.0. http://bioconductor.org/packages/release/bioc/html/SAGx.html.
-
- Bull JJ, Badgett MR, Wichman HA. Big-benefit mutations in a bacteriophage inhibited with heat. Mol Biol Evol. 2000;17(6):942–950. - PubMed
-
- Bull JJ, Millstein J, Orcutt J, Wichman HA. Evolutionary feedback mediated through population density, illustrated with viruses in chemostats. Am Nat. 2006;167(2):E39–E51. - PubMed
