. 2010 Jan 18:2:67-79.
doi: 10.1093/gbe/evq002.

Both noncoding and protein-coding RNAs contribute to gene expression evolution in the primate brain

Affiliations

Both noncoding and protein-coding RNAs contribute to gene expression evolution in the primate brain

Courtney C Babbitt et al. Genome Biol Evol. .

Abstract

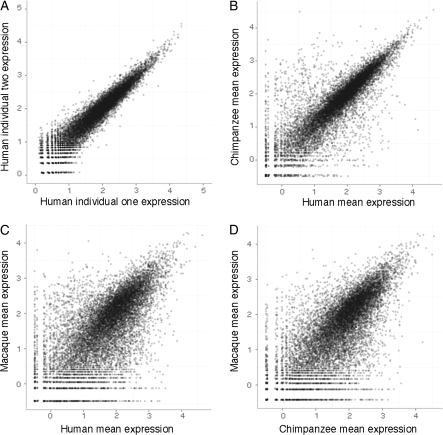
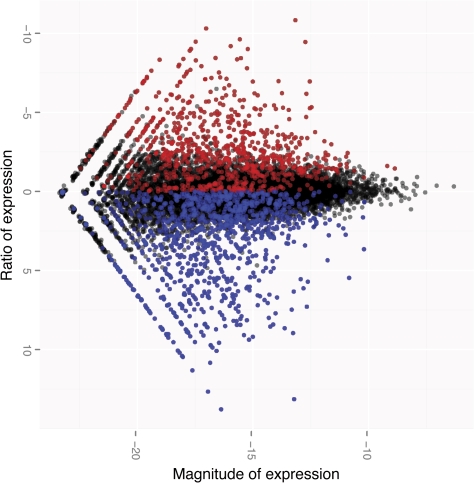
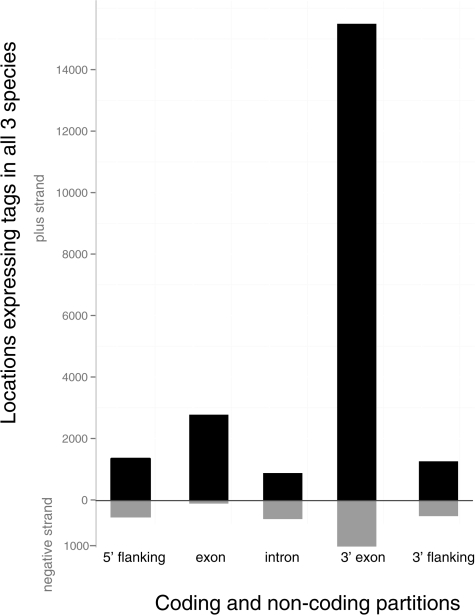
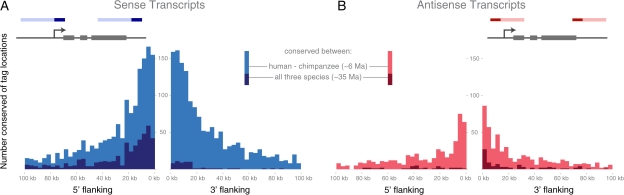
Despite striking differences in cognition and behavior between humans and our closest primate relatives, several studies have found little evidence for adaptive change in protein-coding regions of genes expressed primarily in the brain. Instead, changes in gene expression may underlie many cognitive and behavioral differences. Here, we used digital gene expression: tag profiling (here called Tag-Seq, also called DGE:tag profiling) to assess changes in global transcript abundance in the frontal cortex of the brains of 3 humans, 3 chimpanzees, and 3 rhesus macaques. A substantial fraction of transcripts we identified as differentially transcribed among species were not assayed in previous studies based on microarrays. Differentially expressed tags within coding regions are enriched for gene functions involved in synaptic transmission, transport, oxidative phosphorylation, and lipid metabolism. Importantly, because Tag-Seq technology provides strand-specific information about all polyadenlyated transcripts, we were able to assay expression in noncoding intragenic regions, including both sense and antisense noncoding transcripts (relative to nearby genes). We find that many noncoding transcripts are conserved in both location and expression level between species, suggesting a possible functional role. Lastly, we examined the overlap between differential gene expression and signatures of positive selection within putative promoter regions, a sign that these differences represent adaptations during human evolution. Comparative approaches may provide important insights into genes responsible for differences in cognitive functions between humans and nonhuman primates, as well as highlighting new candidate genes for studies investigating neurological disorders.

Keywords: Tag-Seq; gene expression; noncoding RNA; transcriptional evolution.


Figures

F<sc>IG</sc>. 1.—
FIG. 1.—
Correlations in gene expression between Tag-Seq libraries. Each data point is slightly transparent in order to assist in visualizing the density of data points. (A). Biological replicates between two human individuals. (B). Human–chimpanzee comparison. (C). Human–macaque comparison. (D) Chimpanzee–macaque comparison. Spearman correlation R2 values are 0.92, 0.75, 0.47, and 0.53, respectively.
F<sc>IG</sc>. 2.—
FIG. 2.—
MA plot of the human and chimpanzee brain expression data. The magnitude (x axis) and ratio (y axis) of expression are plotted here for all genes measured. Genes with higher expression levels in humans are the negative ratios here (left of graph). Each data point is slightly transparent in order to assist in visualizing the density of data points. Significantly differentially expressed genes (P < 0.05) are colored by higher expression in humans (red) or chimpanzees (blue).
F<sc>IG</sc>. 3.—
FIG. 3.—
Distribution of tag locations across genomic compartments. Histogram of the number of locations (not the number of tags sequenced from each location) that have conserved locations across an individual of all three species. Tag locations were considered conserved if all species had five or more tags sequenced from the same exact location. Note that a given transcript may have more than one tag site sequenced from it. Compartments where the tags were sequenced on the sense strand (relative to the direction of transcription for each gene) are in black. Antisense transcriptional conserved regions are shown in gray.
F<sc>IG</sc>. 4.—
FIG. 4.—
The distribution of conserved intragenic tags located near genes. The x axis shows the distance from a RefSeq region either upstream (left) or downstream (right) of a gene. Each count on the y axis is the number of locations to which five or more tags map and are conserved in sequence between the following two or three species. (A). Sense tags conserved between humans, chimpanzees, and macaques. (B). Antisense tags conserved between humans, chimpanzees, and macaques. The panels are colored based on conserved transcription. For tags sequenced from the sense strand conservation is indicated between humans and chimpanzees (blue) or between humans, chimpanzees, and macaques (dark blue). For tags from the antisense strand, relative to the proximal gene’s direction of transcription, conservation is labeled between humans and chimpanzees (red) or between humans, chimpanzees, and macaques (dark red). The schematic in the upper corners of each histogram are to illustrate where the tags are coming from relative to the coding regions (gray boxes, the grey arrow indicates the transcriptional start site). The sense (dark blue) or antisense (dark red) tags are coming from RNA transcripts of unknown length (here illustrated in blue [sense] or red [antisense]).

References

    1. Ahituv N, et al. Mapping cis-regulatory domains in the human genome using multi-species conservation of synteny. Hum Mol Genet. 2005;14:3057–3063. - PubMed
    1. Aiello LC, Wheeler P. The expensive-tissue hypothesis—the brain and the digestive-system in human and primate evolution. Curr Anthropol. 1995;36:199–221.
    1. Ambros V, et al. A uniform system for microRNA annotation. RNA. 2003;9:277–279. - PMC - PubMed
    1. Bertone P, et al. Global identification of human transcribed sequences with genome tiling arrays. Science. 2004;306:2242–2246. - PubMed
    1. Birney E, et al. Identification and analysis of functional elements in 1% of the human genome by the encode pilot project. Nature. 2007;447:799–816. - PMC - PubMed