

Distinguishing microbial genome fragments based on their composition: evolutionary and comparative genomic perspectives
- PMID: 20333228
- PMCID: PMC2839357
- DOI: 10.1093/gbe/evq004
Distinguishing microbial genome fragments based on their composition: evolutionary and comparative genomic perspectives
Abstract
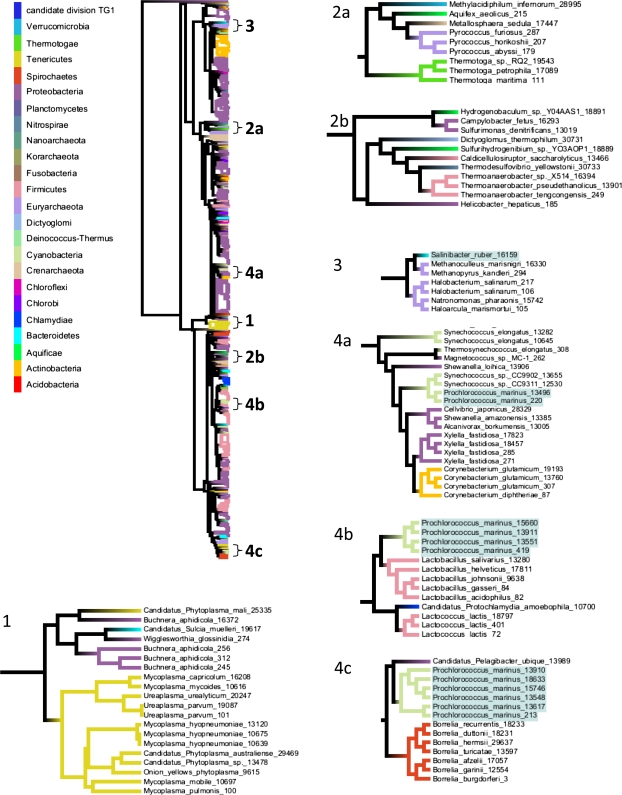
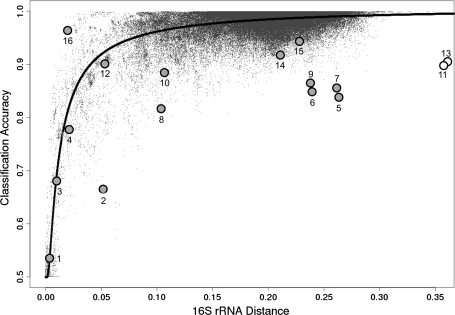
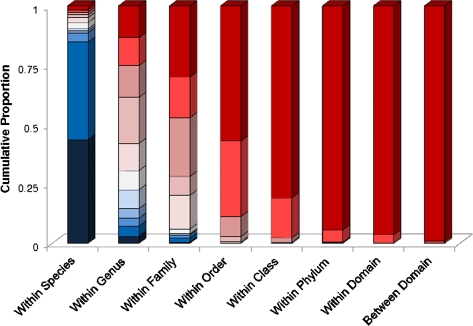
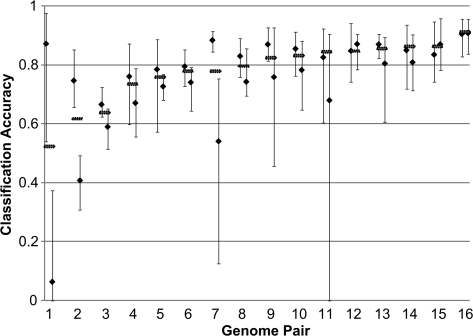
It is well known that patterns of nucleotide composition vary within and among genomes, although the reasons why these variations exist are not completely understood. Between-genome compositional variation has been exploited to assign environmental shotgun sequences to their most likely originating genomes, whereas within-genome variation has been used to identify recently acquired genetic material such as pathogenicity islands. Recent sequence assignment techniques have achieved high levels of accuracy on artificial data sets, but the relative difficulty of distinguishing lineages with varying degrees of relatedness, and different types of genomic sequence, has not been examined in depth. We investigated the compositional differences in a set of 774 sequenced microbial genomes, finding rapid divergence among closely related genomes, but also convergence of compositional patterns among genomes with similar habitats. Support vector machines were then used to distinguish all pairs of genomes based on genome fragments 500 nucleotides in length. The nearly 300,000 accuracy scores obtained from these trials were used to construct general models of distinguishability versus taxonomic and compositional indices of genomic divergence. Unusual genome pairs were evident from their large residuals relative to the fitted model, and we identified several factors including genome reduction, putative lateral genetic transfer, and habitat convergence that influence the distinguishability of genomes. The positional, compositional, and functional context of a fragment within a genome has a strong influence on its likelihood of correct classification, but in a way that depends on the taxonomic and ecological similarity of the comparator genome.
Keywords: genome composition; metagenomics; phylogenetic classification; support vector machines.
Figures
Similar articles
-
Stratification of co-evolving genomic groups using ranked phylogenetic profiles.BMC Bioinformatics. 2009 Oct 27;10:355. doi: 10.1186/1471-2105-10-355. BMC Bioinformatics. 2009. PMID: 19860884 Free PMC article.
-
TACOA: taxonomic classification of environmental genomic fragments using a kernelized nearest neighbor approach.BMC Bioinformatics. 2009 Feb 11;10:56. doi: 10.1186/1471-2105-10-56. BMC Bioinformatics. 2009. PMID: 19210774 Free PMC article.
-
A mathematical method for determining genome divergence and species delineation using AFLP.Int J Syst Evol Microbiol. 2002 Mar;52(Pt 2):573-586. doi: 10.1099/00207713-52-2-573. Int J Syst Evol Microbiol. 2002. PMID: 11931171
-
Compositional features of eukaryotic genomes for checking predicted genes.Brief Bioinform. 2003 Mar;4(1):43-52. doi: 10.1093/bib/4.1.43. Brief Bioinform. 2003. PMID: 12715833 Review.
-
Compositional patterns in vertebrate genomes: conservation and change in evolution.J Mol Evol. 1988 Dec-1989 Feb;28(1-2):7-18. doi: 10.1007/BF02143493. J Mol Evol. 1988. PMID: 3148744 Review.
Cited by
-
Genome Signature Difference between Deinococcus radiodurans and Thermus thermophilus.Int J Evol Biol. 2012;2012:205274. doi: 10.1155/2012/205274. Epub 2012 Mar 4. Int J Evol Biol. 2012. PMID: 22500246 Free PMC article.
-
A Markovian analysis of bacterial genome sequence constraints.PeerJ. 2013 Aug 29;1:e127. doi: 10.7717/peerj.127. eCollection 2013. PeerJ. 2013. PMID: 24010012 Free PMC article.
-
Resolving prokaryotic taxonomy without rRNA: longer oligonucleotide word lengths improve genome and metagenome taxonomic classification.PLoS One. 2013 Jul 1;8(7):e67337. doi: 10.1371/journal.pone.0067337. Print 2013. PLoS One. 2013. PMID: 23840870 Free PMC article.
-
Computational tools for viral metagenomics and their application in clinical research.Virology. 2012 Dec 20;434(2):162-74. doi: 10.1016/j.virol.2012.09.025. Epub 2012 Oct 11. Virology. 2012. PMID: 23062738 Free PMC article. Review.
-
Classifying short genomic fragments from novel lineages using composition and homology.BMC Bioinformatics. 2011 Aug 9;12:328. doi: 10.1186/1471-2105-12-328. BMC Bioinformatics. 2011. PMID: 21827705 Free PMC article.
References
-
- Abe T, Sugawara H, Kinouchi M, Kanaya S, Ikemura T. Novel phylogenetic studies of genomic sequence fragments derived from uncultured microbe mixtures in environmental and clinical samples. DNA Res. 2005;12:281–290. - PubMed
LinkOut - more resources
Full Text Sources
Other Literature Sources
Molecular Biology Databases
