

A Novel Technique of Quantifying Flexural Stiffness of Rod-Like Structures
- PMID: 20333317
- PMCID: PMC2843005
- DOI: 10.1007/s12195-008-0012-z
A Novel Technique of Quantifying Flexural Stiffness of Rod-Like Structures
Abstract
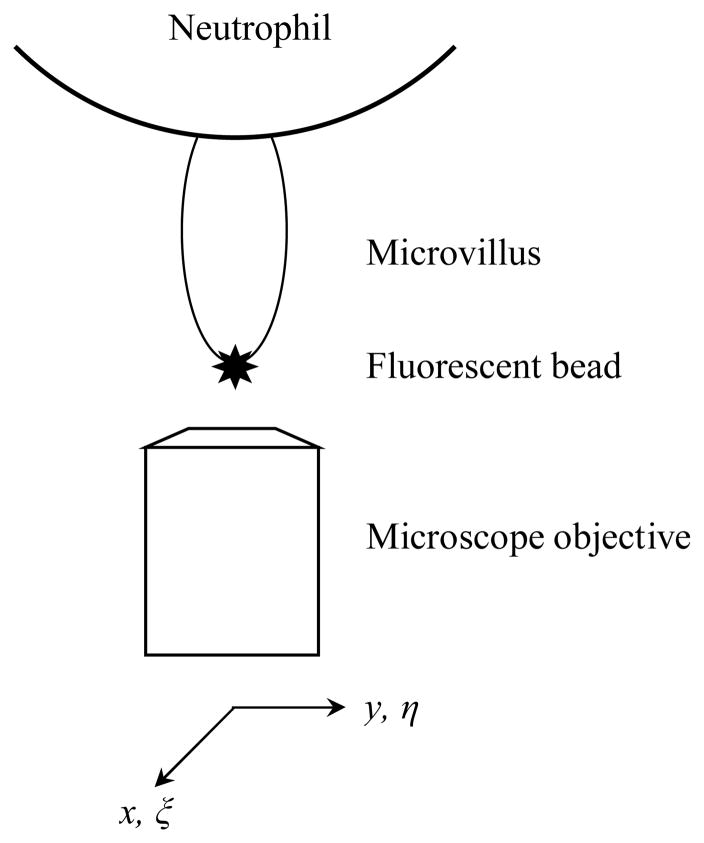
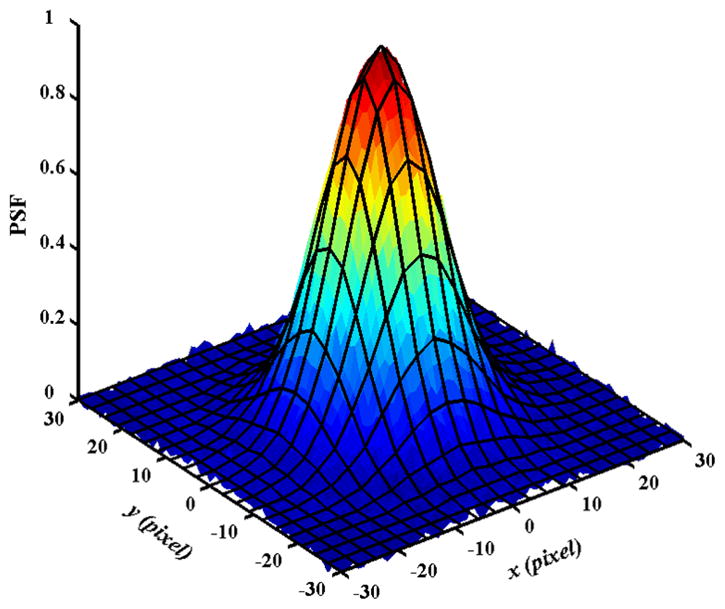
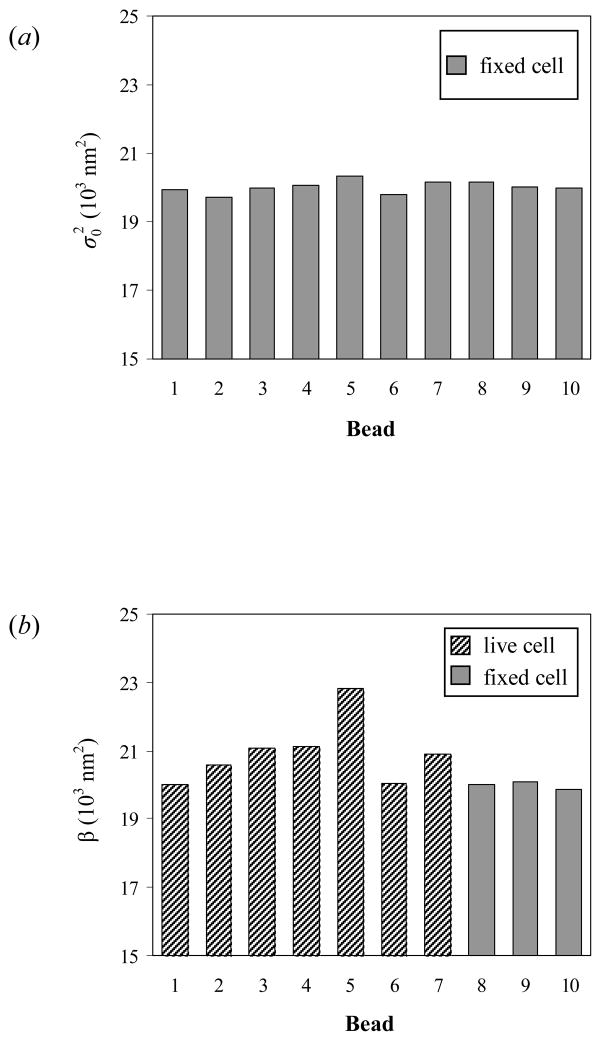
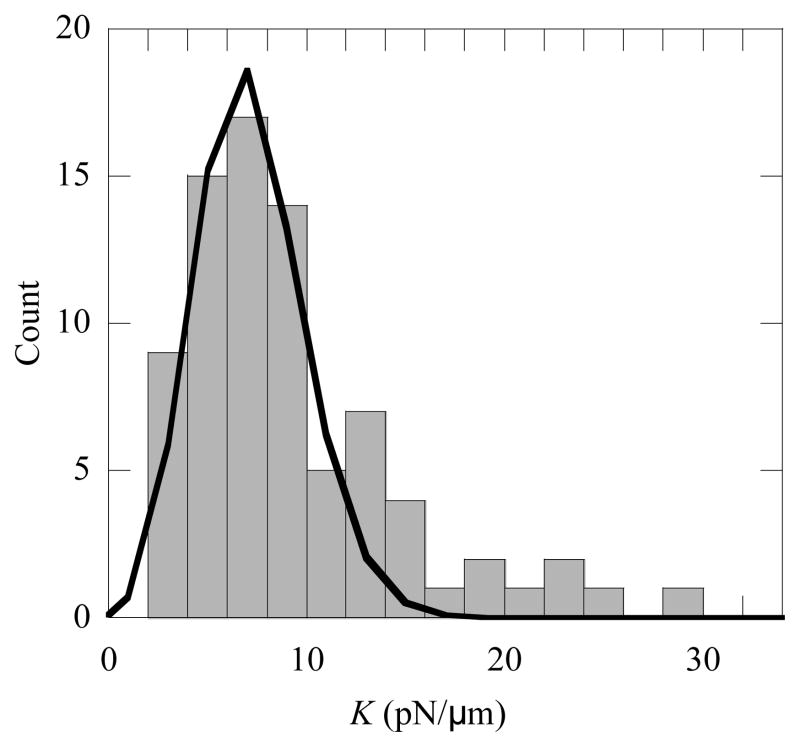
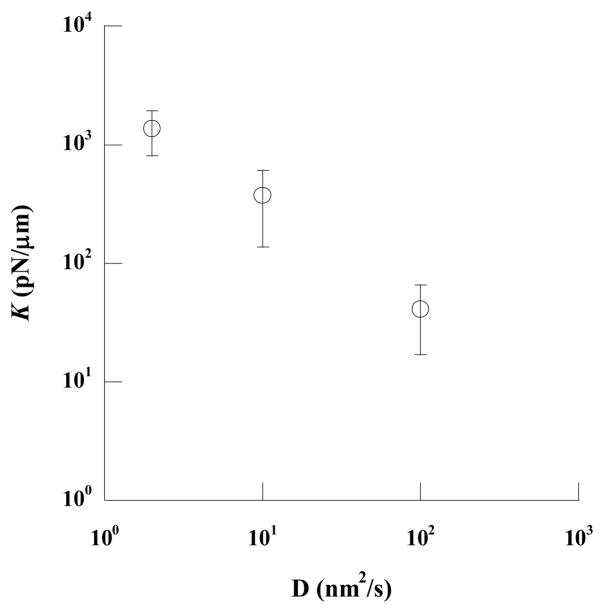
In cellular and molecular biomechanics, extensional stiffness of rod-like structures such as leukocyte microvilli can be easily measured with many techniques, but not many techniques are available for measuring their flexural stiffness. In this paper, we report a novel technique of measuring the flexural stiffness of rod-like structures. This technique is based on image deconvolution and, as an example, it was used for determining the flexural stiffness of neutrophil microvilli. The probes we used were 40-nm-diameter fluorescent beads, which were bound to the tips of neutrophil microvilli by anti-L-selectin antibody. The fluorescent images of the bead, which was positioned at the center of the cell bottom, were acquired with high magnification and long exposure time (3 s). Using a Gaussian function as the point spread function of our imaging system, we established a convolution equation based on Boltzmann's law, which yields an analytical expression that relates the bead image profile to the flexural stiffness of the microvillus. The flexural stiffness was then obtained by the least squares regression. On average, the flexural stiffness was determined to be 7 pN/mum for single neutrophil microvilli. With the resolution of our imaging system, this technique can be used for measuring any flexural stiffness smaller than 34 pN/mum and it has great potential in single molecule biomechanics.
Figures
Similar articles
-
Flexibility of single microvilli on live neutrophils and lymphocytes.Phys Rev E Stat Nonlin Soft Matter Phys. 2007 Aug;76(2 Pt 1):021907. doi: 10.1103/PhysRevE.76.021907. Epub 2007 Aug 7. Phys Rev E Stat Nonlin Soft Matter Phys. 2007. PMID: 17930065
-
Flexural Stiffness of Myosin Va Subdomains as Measured from Tethered Particle Motion.J Biophys. 2015;2015:465693. doi: 10.1155/2015/465693. Epub 2015 Nov 30. J Biophys. 2015. PMID: 26770194 Free PMC article.
-
Design and 3D printing of novel titanium spine rods with lower flexural modulus and stiffness profile with optimised imaging compatibility.Eur Spine J. 2023 Jun;32(6):1953-1965. doi: 10.1007/s00586-023-07674-9. Epub 2023 Apr 13. Eur Spine J. 2023. PMID: 37052651
-
Static and dynamic lengths of neutrophil microvilli.Proc Natl Acad Sci U S A. 1998 Jun 9;95(12):6797-802. doi: 10.1073/pnas.95.12.6797. Proc Natl Acad Sci U S A. 1998. PMID: 9618492 Free PMC article.
-
Presence of brush cells in the mouse gallbladder.Microsc Res Tech. 1997 Sep 15;38(6):598-608. doi: 10.1002/(SICI)1097-0029(19970915)38:6<598::AID-JEMT4>3.0.CO;2-B. Microsc Res Tech. 1997. PMID: 9330348 Review.
References
Grants and funding
LinkOut - more resources
Full Text Sources
