. 2010 May 4;49(17):3545-54.
doi: 10.1021/bi100042b.

The p12 subunit of human polymerase delta modulates the rate and fidelity of DNA synthesis

Affiliations

The p12 subunit of human polymerase delta modulates the rate and fidelity of DNA synthesis

Xiao Meng et al. Biochemistry. .

Abstract

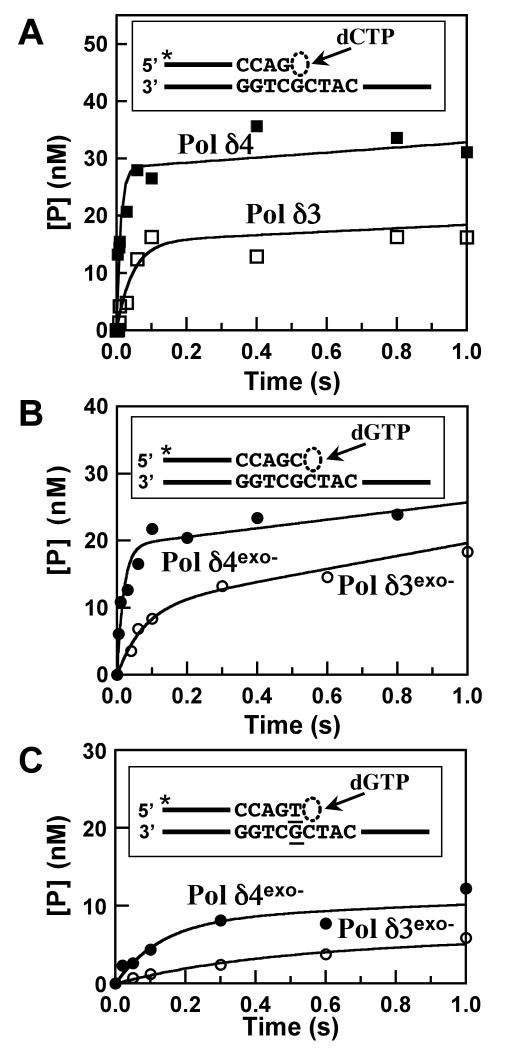
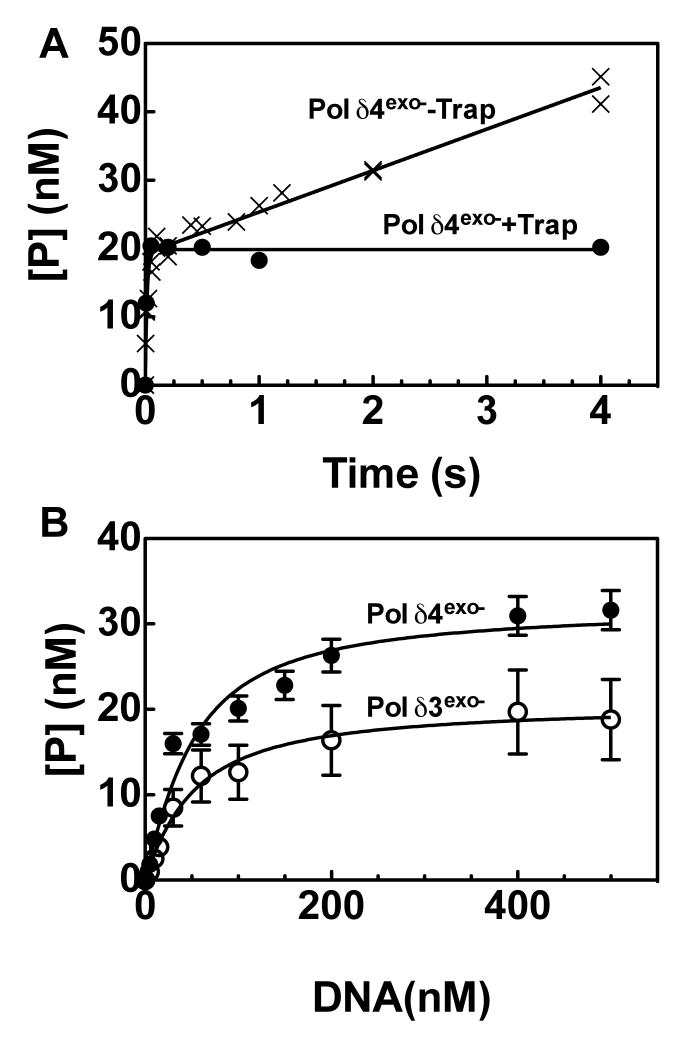
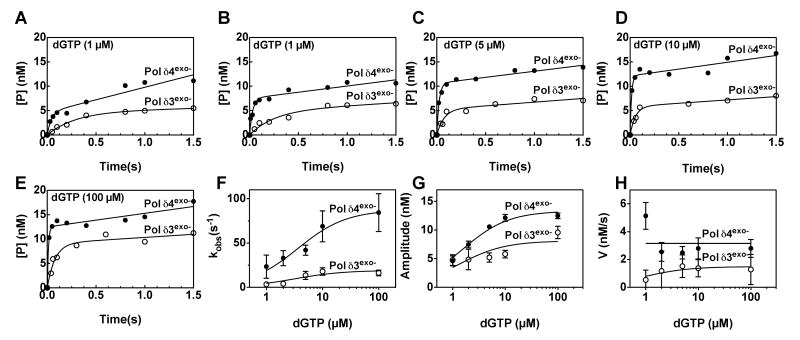
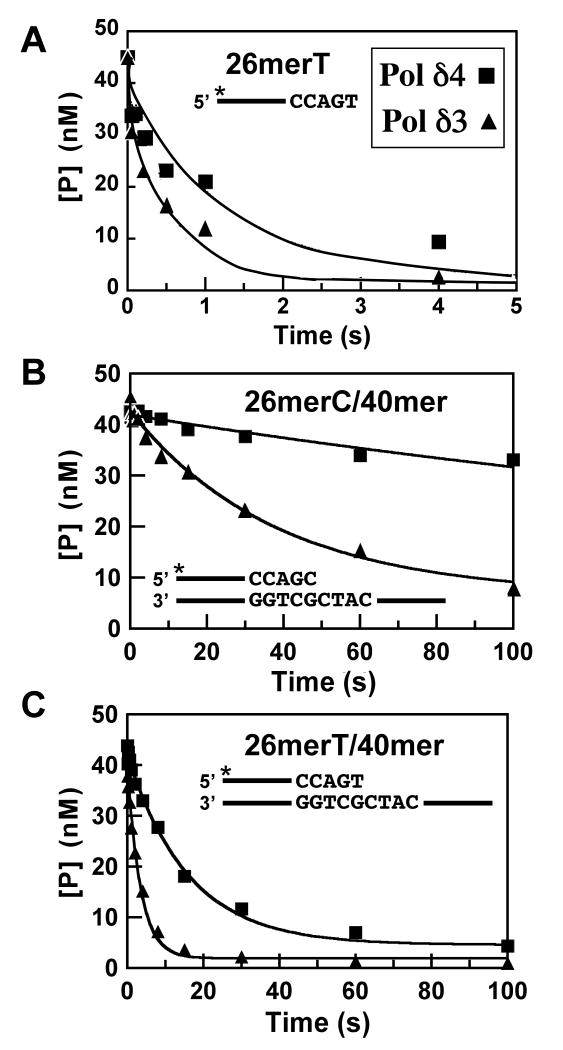
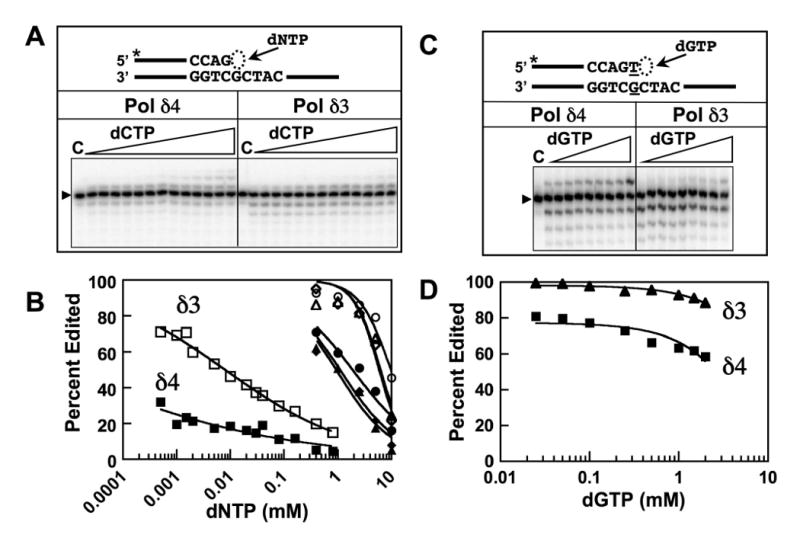
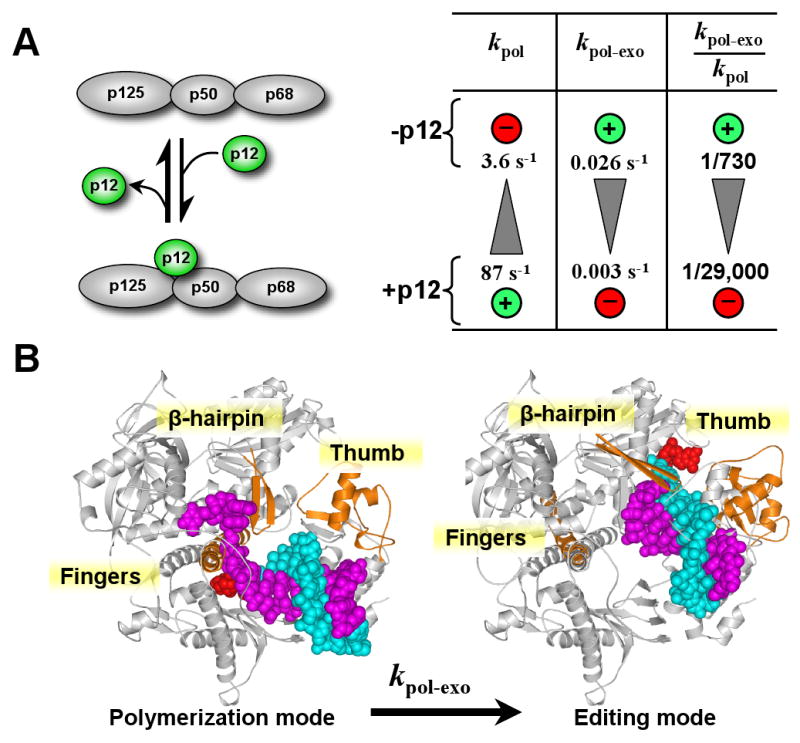
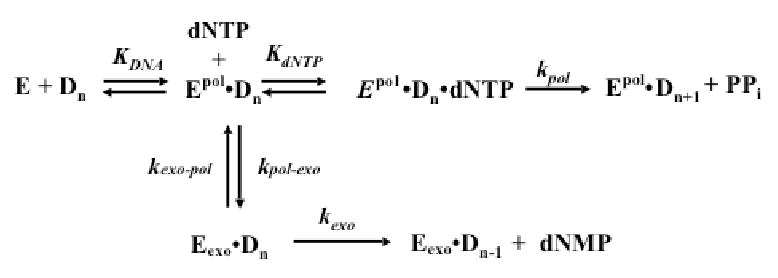
This study examines the role of the p12 subunit in the function of the human DNA polymerase delta (Pol delta) holoenzyme by comparing the kinetics of DNA synthesis and degradation catalyzed by the four-subunit complex, the three-subunit complex lacking p12, and site-directed mutants of each lacking proofreading exonuclease activity. Results show that p12 modulates the rate and fidelity of DNA synthesis by Pol delta. All four complexes synthesize DNA in a rapid burst phase and a slower, more linear phase. In the presence of p12, the burst rates of DNA synthesis are approximately 5 times faster, while the affinity of the enzyme for its DNA and dNTP substrates appears unchanged. The p12 subunit alters Pol delta fidelity by modulating the proofreading 3' to 5' exonuclease activity. In the absence of p12, Pol delta is more likely to proofread DNA synthesis because it cleaves single-stranded DNA twice as fast and transfers mismatched DNA from the polymerase to the exonuclease sites 9 times faster. Pol delta also extends mismatched primers 3 times more slowly in the absence of p12. Taken together, the changes that p12 exerts on Pol delta are ones that can modulate its fidelity of DNA synthesis. The loss of p12, which occurs in cells upon exposure to DNA-damaging agents, converts Pol delta to a form that has an increased capacity for proofreading.


Figures

FIGURE 1
FIGURE 1
Pre-steady state kinetics of DNA synthesis catalyzed by human Pol δ4 and Pol δ3. (A) Reactions with wildtype Pol δ4 and Pol δ3 were performed as described in Experimental Procedures using a rapid quench apparatus and the reaction products representing addition of a single nucleotide to the primer were determined. Reactions contained Pol δ4 or Pol δ3 (50 nM p125), 500 nM [5′-32P]25mer/40mer (see inset), and 500 μM dCTP. Primers extended by one nucleotide ([5′-32P]26mer, [P]) are plotted vs. time. Data are fit to equation 1 with the following parameters: Pol δ4 (solid squares) [ED] = 26.2 nM, kobs = 72.7 s-1, v= 4.6 nM/s; Pol δ3 (open squares), [ED] = 18.6 nM, kobs = 16.7 s-1, v= 3.0 nM/s. (B) Pre-steady state kinetics of DNA synthesis catalyzed by the exonuclease deficient forms of Pol δ4 and Pol δ3. Reactions contained Pol δ4exo- or Pol δ3exo- (40 nM p125), 250 nM [5′-32P]26merC/40mer (see inset), and 500 μM dGTP. Data are fit to equation 1 with the following constants: Pol δ4exo- (solid circles), [ED] = 19.3 nM, kobs = 54.7 s-1, v= 6.4 nM/s; Pol δ3exo (open circles), [ED] = 10.0 nM, kobs = 13.3 s-1, and v= 9.6 nM/s. (C) Pre-steady state kinetics of DNA synthesis catalyzed by Pol δ4exo- or Pol δ3exo- in the presence of a mismatched DNA substrate. 40 nM of p125, 200 nM mismatched [5′-32P]26merT/40mer (see inset; the T:G mismatch is underlined), and 500 μM dGTP. Data are fit to equation 1 using the following constants: Pol δ4exo- : kobs = 7.6 s-1, [ED] = 8.3 nM, v=1.9 nM/s; Pol δ3exo- :kobs = 2.5 s-1. [ED]= 4.4 nM, v= 0.9 nM/s. Data for Pol δ4 and Pol δ3 are shown as solid and open squares, respectively, and for Pol δ4exo- and Pol δ3exo- as solid and open circles, respectively.
FIGURE 2
FIGURE 2
Effect of DNA primer/template concentration on the amplitude of the burst phase of DNA synthesis catalyzed by Pol δ4exo- or Pol δ3exo-. (A) Effect of an enzyme trap. The reaction shown in Fig. 1B (x′s) was repeated in the presence of an enzyme trap (0.5 mg/ml calf-thymus DNA). The trap abolished the slow phase of the reaction catalyzed by Pol δ4exo- (solid circles), and data was fit to equation 1 with the following parameters [ED] = 19.8 nM, kobs = 94 s-1, v= 0 nM/s (B) Single turnover reactions (see Experimental Procedures) containing Pol δ4exo- or Pol δ3exo- (20 nM p125), 500 μM dGTP, 0.5 mg/ml calf thymus DNA and the indicated amounts of [5′-32P]26merC/40mer. Product concentration ([P]) at 1 s, which reflects the burst amplitude ([ED]) of the reaction, is plotted versus DNA concentration and fit to equation 3 with a KDNA of 34 ± 5.4 nM for Pol δ4exo- and 35 ± 6.5 nM for Pol δ3exo-. Data for Pol δ4exo- and Pol δ3exo- are shown as filled and solid circles, respectively.
FIGURE 3
FIGURE 3
Effect of dNTP concentration on the pre-steady state kinetics of Pol δ4 and Pol δ3 catalyzed DNA synthesis. Reactions contained Pol δ4exo- (filled circles) or Pol δ3exo- (open circles), each at 20 nM p125, 250 nM [5′-32P]26C/40mer template (see inset, Fig. 1), and varying concentrations of dGTP ((A), 1 μM; (B), 2 μM; (C), 5 μM; (D), 10 μM; (E) 100 μM). Data were fit to equation 1. (F) kobs values from fits in panels A-E as a function of dGTP concentration. Data are fit to equation 2 with a kpol of 87 ± 12 s-1 and a Kd dGTP of 3.6 ± 0.8 μM for Pol δ4exo-, and kpol of 19 ± 2.8 s-1 and a KdGTP of 3.2 ± 1.6 μM for Pol δ3exo-. (G) Reaction amplitudes ([ED]) from the fits in panels A-E as function of dGTP concentration. Data are fit to a one site binding equation with a Bmax of 13 ± 3 nM and a Kd of 1.6 ± 0.6 μM for Pol δ4exo-, and Bmax of 8 ± 4 nM and a Kd of 1.3 ± 0.9 μM for Pol δ4exo- for Pol δ3exo-. (H) Slow phase velocities (v) from fits in panels A-E as function of dGTP concentration. Data are fit to equation 3 with a Vmax of 3.1 ± 2.0 nM/s μM for Pol δ4exo-, and Vmax of 1.4 ± 0.6 nM/s for Pol δ4exo- and a Km of 0.8 ± 0.5 for Pol δ3exo-. Data in (A-F) are from single reaction sets, but two additional assay sets were performed prior, to determine appropriate time and concentration ranges. Fits to the other datasets yielded constants within the stated errors. Error bars and uncertainties reflect the standard error for the curve fits.
FIGURE 4
FIGURE 4
Determination of the rates of exonuclease cleavage of ssDNA and dsDNA by Pol δ4 and Pol δ3. Reactions were performed as described in Experimental Procedures using a rapid quench apparatus under single turnover conditions. The final reactions contained Pol δ3 or Pol δ4 (100 nM p125) and 50 nM DNA substrate. Reactions were initiated by addition of 10 mM Mg2+, and quenched at various times (from 0.05s to 150s). The remaining 26mer was determined and the data were fit into an exponential decay equation (Equation 5), and yield observed rates of excision. (A) Time course of hydrolysis of a 26mer ssDNA DNA, [5′-32P]26merT, by Pol δ4 (squares) and Pol δ3 (triangles); values for the rates are given as kexo in Table 1. (B) Time course of hydrolysis of a 26mer/40mer duplex DNA, [5′-32P]26merC/40mer, by Pol δ4 (squares) and Pol δ3 (triangles); values for the rates are given in Table 1 as the rates for switching of the primer terminus from the pol to the exo site (kpol-exo, Scheme I). (C) Time course of hydrolysis of a 26mer/40mer duplex DNA containing a mismatched primer terminus, [5′-32P]26merT/40mer, by Pol δ4 (squares) and Pol δ3 (triangles); values for the rates are given in Table 1 as the rates for switching of the primer terminus from the pol to the exo site (kpol-exo, mismatch).
FIGURE 5
FIGURE 5
Steady-state rates of Pol δ polymerase and exonuclease activities in the presence of varying concentrations of the correct or an incorrect nucleotide. Reactions contained catalytic amounts (2 nM p125) of wild type Pol δ4 or Pol δ3, 250 nM of the indicated templates, and individual dNTPs as indicated (Experimental Procedures). (A) Product formation by Pol δ4 or Pol δ3 on a matched primer (25mer/40mer, inset). The gel shows the product formation when the reactions were performed with increasing concentrations of the correct nucleotide, dCTP (0.5, 1, 1.5, 2, 5,10, 20, 30, 40, 80, 160, 400, and 800 mM). Lane C is a control with no enzyme added, and the arrowhead indicates the position of the 25mer primer. (B) Reactions with dCTP or the individual incorrect nucleotides were performed as in panel A. Percentages of substrate that were edited by Pol δ were calculated as the percentage of the total exonucleolytic products over the sum of the exonucleolytic and extension products (equation 6), and plotted as Percent Edited vs log[dNTP]. Data for dCTP, squares; dATP, triangles; dTTP, circles; dGTP, diamonds. Data for Pol δ4 are shown as solid symbols and that for Pol δ3 as open symbols. (C) Product formation by Pol δ4 or Pol δ3 on a mismatched primer (26merT/40mer, inset). Reactions were performed as in panel A, and the products formed with dGTP, the next correct nucleotide are shown in the gel. Concentrations of dGTP used were 0.025, 0.05, 0.10, 0.25, 0.5, 1.0, 1.5, and 2.0 mM). Data for Pol δ4 are shown as squares and that for Pol δ3 as circles. Lane C is a control with no enzyme added, and the arrowhead indicates the position of the 26merT primer. (D) Percentages of substrate that were edited by Pol δ4 (solid squares) and Pol δ3 (solid triangles) were calculated as for Panel B and plotted against log[dGTP]. No extension was observed with either Pol δ4 or Pol δ3 in the presence of dATP, dTTP, or dGTP.
FIGURE 6
FIGURE 6
The p12 subunit of Pol δ acts as a gearshift that alters the rates of polymerization and primer switching. (A) Diagram of the effects of p12 on Pol δ. The first two columns show the effects of p12 on the kinetic constants for polymerization (kpol) and translocation of the primer terminus from the pol to the exo site (kpol-exo), respectively. The third column shows the effects on proofreading efficiency, expressed as the ratio kpol-exo:kpol. The shaded triangles indicate the direction of change the direction of change of the rate constants from low to high, and the circled plus and minus signs indicate the effects of the presence and absence of p12 on the rate constants. (B) Models of the switch of the DNA from the pol to the exo sites of Pol δ The model on the left is the recently published structure of the yeast Pol δ catalytic subunit (19) in the polymerization mode, viz., in a ternary complex bound to a primer (cyan), template (magenta) and nucleoside triphosphate (red) (protein data bank (PDB) file 1IAY). The right model shows a putative structure of yeast Pol δ in the editing mode, which was made by aligning the yeast Pol δ structure (1IAY) and a structure of the related RB69 polymerase (PDB file 1CLQ) with DNA bound in the in the exonuclease site (20). The RB69 and Pol δ structures superimpose except along one helix in the fingers domain, the tip of thumb domain, and a β-hairpin. These three regions of RB69 are shown (orange) to point out the conformational changes needed to transfer the primer between the pol and exo sites. The fingers, thumb and b-hairpin structures of yeast Pol δ are highlighted (orange) in the left model. The rest of the RB69 protein is not shown for clarity, but the primer (cyan), the primer 3′ terminus (red), and template (magenta) bound to RB69 are shown to mark the exonuclease site of Pol δ (grey).
Scheme 1
Scheme 1. Reactions involved in Pol δ-catalyzed DNA synthesis and editing
Epol and Eexo indicate DNA binding to pol site or exo sites, respectively.

Similar articles

Cited by

References

    1. Nachman MW, Crowell SL. Estimate of the mutation rate per nucleotide in humans. Genetics. 2000;156:297–304. - PMC - PubMed
    1. Steitz TA. DNA polymerases: structural diversity and common mechanisms. J Biol Chem. 1999;274:17395–17398. - PubMed
    1. Johnson KA. Conformational coupling in DNA polymerase fidelity. Annu Rev Biochem. 1993;62:685–713. - PubMed
    1. Kunkel TA, Bebenek K. DNA replication fidelity. Annu Rev Biochem. 2000;69:497–529. - PubMed
    1. Doublie S, Sawaya MR, Ellenberger T. An open and closed case for all polymerases. Structure. 1999;7:R31–5. - PubMed

Publication types