

Automated characterization of cell shape changes during amoeboid motility by skeletonization
- PMID: 20334652
- PMCID: PMC2864235
- DOI: 10.1186/1752-0509-4-33
Automated characterization of cell shape changes during amoeboid motility by skeletonization
Abstract
Background: The ability of a cell to change shape is crucial for the proper function of many cellular processes, including cell migration. One type of cell migration, referred to as amoeboid motility, involves alternating cycles of morphological expansion and retraction. Traditionally, this process has been characterized by a number of parameters providing global information about shape changes, which are insufficient to distinguish phenotypes based on local pseudopodial activities that typify amoeboid motility.
Results: We developed a method that automatically detects and characterizes pseudopodial behavior of cells. The method uses skeletonization, a technique from morphological image processing to reduce a shape into a series of connected lines. It involves a series of automatic algorithms including image segmentation, boundary smoothing, skeletonization and branch pruning, and takes into account the cell shape changes between successive frames to detect protrusion and retraction activities. In addition, the activities are clustered into different groups, each representing the protruding and retracting history of an individual pseudopod.
Conclusions: We illustrate the algorithms on movies of chemotaxing Dictyostelium cells and show that our method makes it possible to capture the spatial and temporal dynamics as well as the stochastic features of the pseudopodial behavior. Thus, the method provides a powerful tool for investigating amoeboid motility.
Figures

 ) are growing, while black regions (
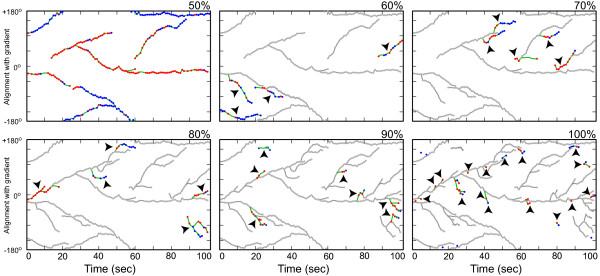
 ) are withdrawing. D. Branches of the skeleton in the latter frame (red lines) signal protrusion activities if they are pointing at regions in , and branches of the skeleton in the earlier frame (blue lines) signal retractions if they are pointing at regions in . The starting positions of these activities are decided by the points where Sn+1 or Sn intersects the boundary curve of the earlier frame (red dots for protrusions and blue dots for retractions). The size of an activity is calculated as the length of the part of associated branch that resides in the growing (L1 in D1) or withdrawing (L2 in D2) area. E. The relative angle of a protrusion (θ3) or retraction (θ4) is defined when the cell is moving in response to a gradient of chemoattractant, based on the center of the cell in the earlier frame (the black dot) and the starting point of the activity (red dot for protrusion and blue dot for retraction).


References
-
- Stossel TP. The E. Donnall Thomas Lecture, 1993. The machinery of blood cell movements. Blood. 1994;84(2):367–379. - PubMed
-
- Soll DR, Voss E, Wessels D, Kuhl S. In: Imaging Cellular and Molecular Biological Functions. Shorte SL, Frischknecht F, editor. Heidelberg: Springer-Verlag; 2007. Computer-Assisted Systems for Dynamic 3D Reconstruction and Motion Analysis of Living Cells; pp. 365–384. full_text.
Publication types
MeSH terms
Grants and funding
LinkOut - more resources
Full Text Sources
Molecular Biology Databases
