. 2010 Mar 24:9:67.
doi: 10.1186/1476-4598-9-67.

Mouse Rad1 deletion enhances susceptibility for skin tumor development

Affiliations

Mouse Rad1 deletion enhances susceptibility for skin tumor development

Lu Han et al. Mol Cancer. .

Abstract

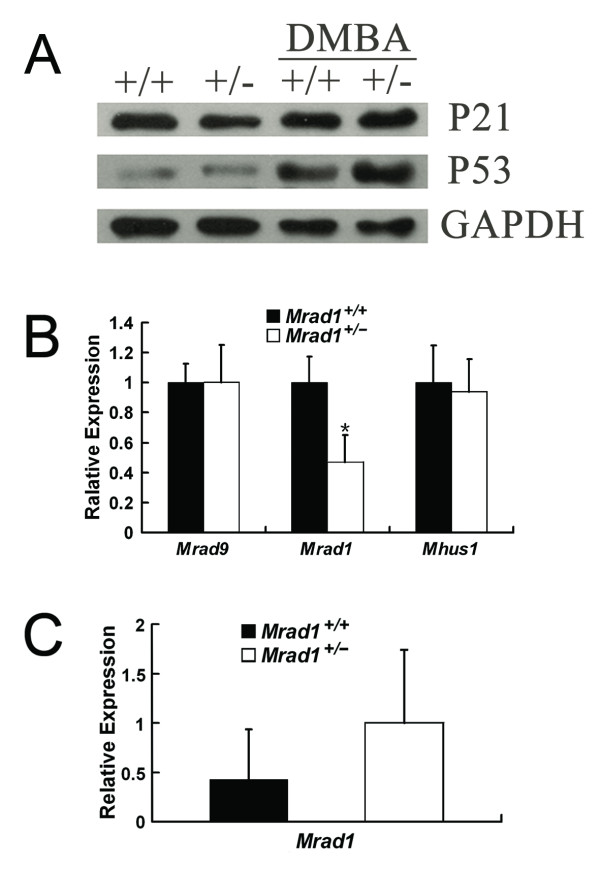
Background: Cells are constantly exposed to stresses from cellular metabolites as well as environmental genotoxins. DNA damage caused by these genotoxins can be efficiently fixed by DNA repair in cooperation with cell cycle checkpoints. Unrepaired DNA lesions can lead to cell death, gene mutation and cancer. The Rad1 protein, evolutionarily conserved from yeast to humans, exists in cells as monomer as well as a component in the 9-1-1 protein complex. Rad1 plays crucial roles in DNA repair and cell cycle checkpoint control, but its contribution to carcinogenesis is unknown.

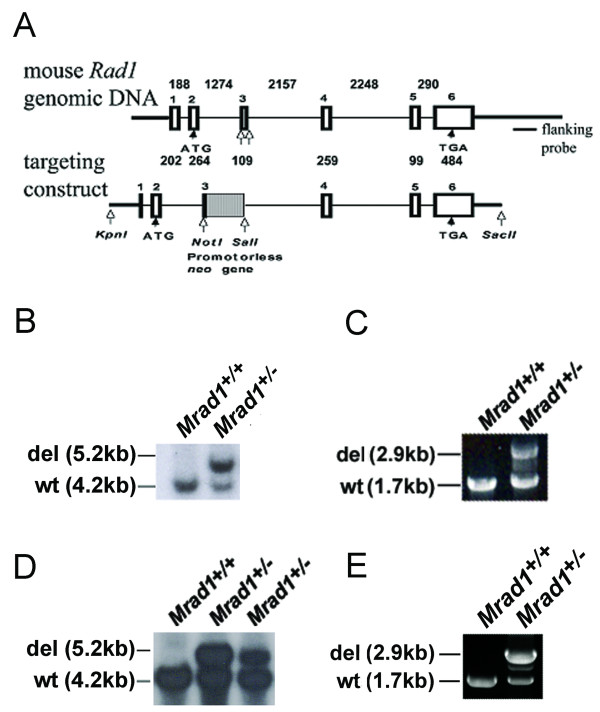
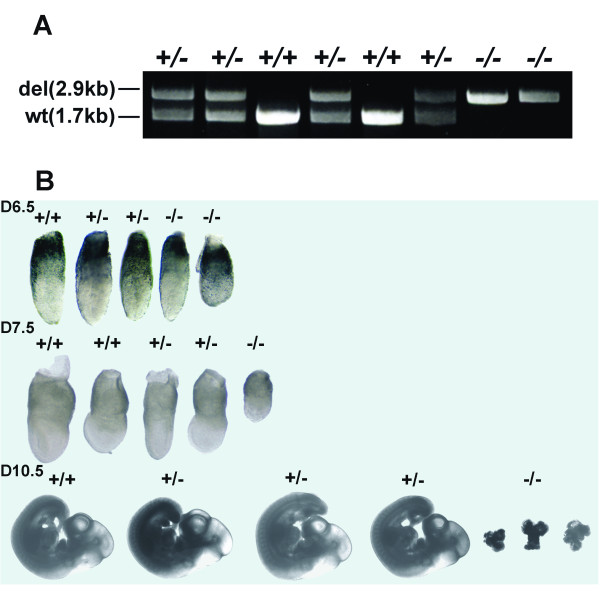
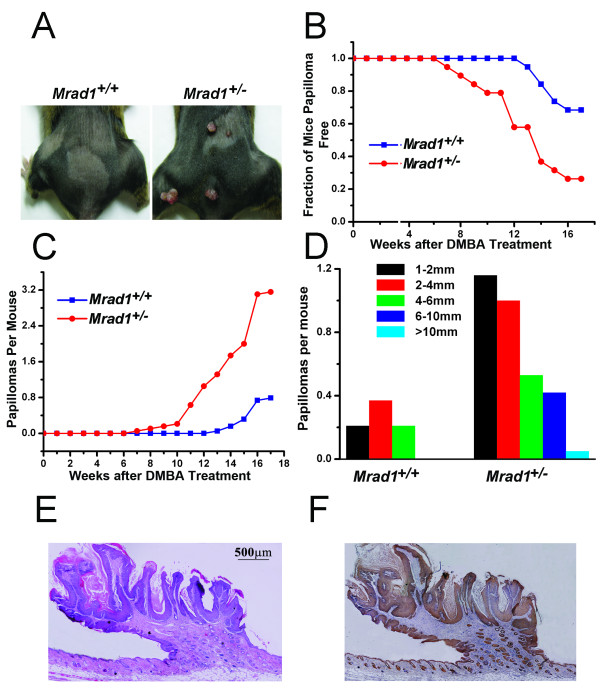
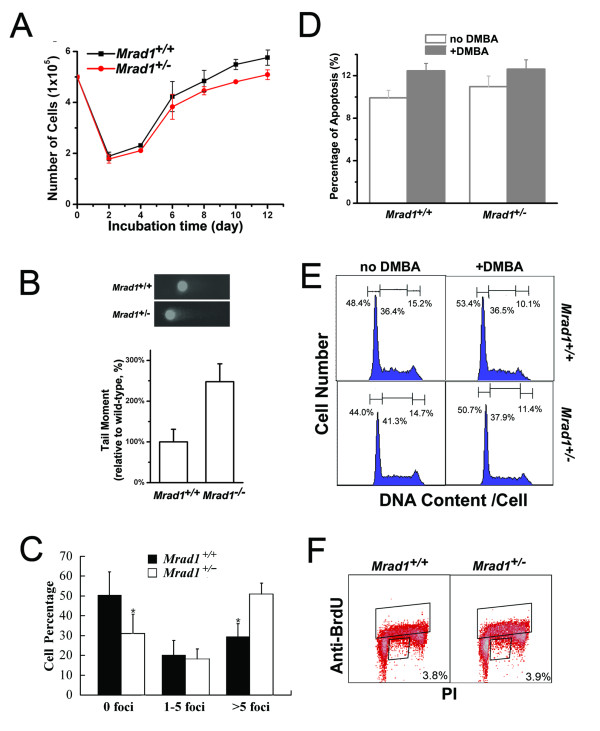
Results: To address this question, we constructed mice with a deletion of Mrad1. Matings between heterozygous Mrad1 mutant mice produced Mrad1+/+ and Mrad1+/- but no Mrad1-/- progeny, suggesting the Mrad1 null is embryonic lethal. Mrad1+/- mice demonstrated no overt abnormalities up to one and half years of age. DMBA-TPA combinational treatment was used to induce tumors on mouse skin. Tumors were larger, more numerous, and appeared earlier on the skin of Mrad1+/- mice compared to Mrad1+/+ animals. Keratinocytes isolated from Mrad1+/- mice had significantly more spontaneous DNA double strand breaks, proliferated slower and had slightly enhanced spontaneous apoptosis than Mrad1+/+ control cells.

Conclusion: These data suggest that Mrad1 is important for preventing tumor development, probably through maintaining genomic integrity. The effects of heterozygous deletion of Mrad1 on proliferation and apoptosis of keratinocytes is different from those resulted from Mrad9 heterozygous deletion (from our previous study), suggesting that Mrad1 also functions independent of Mrad9 besides its role in the Mrad9-Mrad1-Mhus1 complex in mouse cells.


Figures

Figure 1
Figure 1
Targeted deletion of Mrad1. A, Top panel: Mrad1 genomic DNA; Bottom panel: targeting construct. White boxes: exons; Gray box: promotorless neo gene; black thin lines: introns; Black thick lines: DNA sequences outside of Mrad1 genomic DNA; Numbers above: lengths of introns in bp; Numbers below: lengths of exons in bp; White arrows: restriction enzyme cutting sites (targeting construct) and locations around the DNA sequence to be removed (genomic DNA); B, Southern blot analysis of the Mrad1 gene in mouse ES cells. Bands indicate wild-type and deleted Mrad1 allele. C, PCR to assess genotypes in mouse ES cells. Bands indicate wild-type and deleted Mrad1 allele. D, Southern blot analysis of the Mrad1 gene in mice. E, Mrad1 genotyping in mice using PCR.
Figure 2
Figure 2
Gross morphology of mouse embryos derived from Mrad1+/- × Mrad1+/- crosses. A, PCR genotyping of Mrad1 in mice. Yolk sac genomic DNA was used as template. B, Representative gross morphology of Mrad1 mouse embryos at E6.5, E7.5 and E10.5. A complete liter of embryos at each stage are presented. +/+, Mrad1+/+; +/-, Mrad1+/-; -/-, Mrad1-/-.
Figure 3
Figure 3
Skin tumor induction by DMBA-TPA treatment. A, Papillomas induced by DMBA-TPA treatment in Mrad1+/+ mouse skin (left) and treated Mrad1+/- mouse skin (right). B, Incidence of papilloma-free mice after DMBA-TPA treatment. Kaplan-Meier plot of tumor-free state as a function of time after DMBA painting followed by TPA treatment (blue, Mrad1+/+; red, Mrad1+/-). Mrad1+/+ and Mrad1+/- mice (n = 38) were initially treated once with DMBA at week 1 on the skin topically starting at ages 7 to 8 weeks, and TPA twice weekly for 17 weeks. There was a significant difference in papilloma formation between Mrad1+/+ and Mrad1+/- mice (P = 0.003). C, Average numbers of papillomas on each mouse (blue, Mrad1+/+; red, Mrad1+/-). Only papillomas larger than 1 mm diameter were counted. There was a significant difference in the number of papillomas per mouse between two the genotypes at the 17-week end point (P = 0.010). D, Size distribution of papillomas. The length of a papilloma was used to represent its size. E, H & E staining for papillomas. A typical papilloma was shown, with connective tissues extending into the tumor. F, Keratin 14 staining for keratinocytes. The same tumor sample in E was also stained for Keratin 14, and it was thus shown to be derived from keratinocytes.
Figure 4
Figure 4
Proliferation, spontaneous DNA DSBs, apoptosis and cell cycle distribution of Mrad1+/+ and Mrad1+/- keratinocytes. A, Proliferation of skin keratinocytes. The average results were derived from three independent experiments. B, Spontaneous DNA double strand breaks detected with comet assay. The mean values were derived from three independent experiments, and each was the average of assays on 50 cells. C, Spontaneous DNA double strand breaks detected with γ-H2AX labeling. Assessments were made by counting foci in at least 100 cells for every sample, and the result shown is the mean of triplicate samples for each genotype. Statistical analyses: n = 3, P = 0.007 for 0 foci, P = 0.42 for 1-5 foci and P = 0.0009 for more 5 foci, D. Quantitative comparison of apoptosis between Mrad1+/+ and Mrad1+/- keratinocytes mock-treated and treated with DMBA for 24 h. The apoptotic levels were analyzed using Annexin V labeling. E, Comparison of cell cycle distribution of Mrad1+/+ and Mrad1+/- keratinocytes mock-treated and treated with DMBA. The numbers above each phase indicate the percentage of cells in that phase among the whole cell population. Mrad1+/- cells in G1 phase were not more than Mrad1+/+ cells in G1 phase. DMBA-TPA treatment slightly arrested cells in G1 phase. F, The cell cycle distributions of Mrad1+/+ and Mrad1+/- keratinocytes monitored with BrdUrd uptake. The cells were stained with both PI and anti-BrdUrd. The top box indicates BrdUrd-positive cells, and the number in the bottom right box is the percentage of BrdUrd-negative cells with late S phase DNA content.
Figure 5
Figure 5
Expression of cell cycle checkpoint genes. A. Expression of p21 and p53 in Mrad1+/+ and Mrad1+/- keratinocytes. Western blotting analysis of p21 and p53 protein levels in keratinocytes incubated for four days after isolation. The first two lanes are the protein levels in cells without DMBA treatment, and the last two lanes are proteins from cells treated with 0.15 μg/ml DMBA for 24 hours. The data in the figure represent results from three independent western blotting experiments. +/+ and +/- indicate Mrad1+/+ and Mrad1+/- genotypes, respectively. B. Mrad9 and Mhus1 expression levels in Mrad1+/+ and Mrad1+/- keratinocytes. The gene expression levels were analyzed with real-time quantitative RT-PCR. Each result is the average ratio of the PCR results of an indicated gene relative to β-actin level for three independent samples, and each PCR result is the mean of triplicate PCR of the same sample. The difference of the Mrad1 expression levels between Mrad1+/- and Mrad1+/- cells is statistically significant (n = 3, P = 0.022). Either Mrad9 or Mhus1 expression levels were similar in both Mrad1+/+ and Mrad1+/- keratinocytes. C. Mrad1 expression levels in Mrad1+/+ and Mrad1+/- tumors. The expression levels of Mrad1 were analyzed by PCR as in B in this figure legend, and no statistical significance (n = 3, P = 0.34).

References

    1. Deng CX. BRCA1: cell cycle checkpoint, genetic instability, DNA damage response and cancer evolution. Nucleic Acids Res. 2006;34:1416–1426. doi: 10.1093/nar/gkl010. - DOI - PMC - PubMed
    1. Houtgraaf JH, Versmissen J, Giessen WJ van der. A concise review of DNA damage checkpoints and repair in mammalian cells. Cardiovasc Revasc Med. 2006;7:165–172. doi: 10.1016/j.carrev.2006.02.002. - DOI - PubMed
    1. Lieberman HB. Rad9, an evolutionarily conserved gene with multiple functions for preserving genomic integrity. J Cell Biochem. 2006;97:690–697. doi: 10.1002/jcb.20759. - DOI - PubMed
    1. Parrilla-Castellar ER, Arlander SJ, Karnitz L. Dial 9-1-1 for DNA damage: the Rad9-Hus1-Rad1 (9-1-1) clamp complex. DNA Repair (Amst) 2004;3:1009–1014. doi: 10.1016/j.dnarep.2004.03.032. - DOI - PubMed
    1. Helt CE, Wang W, Keng PC, Bambara RA. Evidence that DNA damage detection machinery participates in DNA repair. Cell Cycle. 2005;4:529–532. - PubMed

Publication types