Meta-Analysis
. 2010 Mar 24:11:197.
doi: 10.1186/1471-2164-11-197.

Reciprocal regulation of metabolic and signaling pathways

Affiliations
Meta-Analysis

Reciprocal regulation of metabolic and signaling pathways

Andreas S Barth et al. BMC Genomics. .

Abstract

Background: By studying genome-wide expression patterns in healthy and diseased tissues across a wide range of pathophysiological conditions, DNA microarrays have revealed unique insights into complex diseases. However, the high-dimensionality of microarray data makes interpretation of heterogeneous gene expression studies inherently difficult.

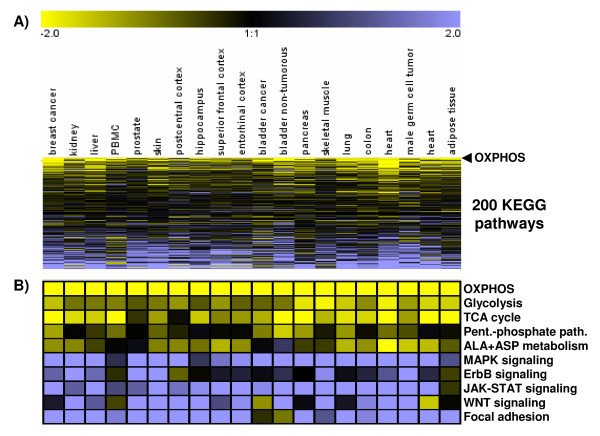
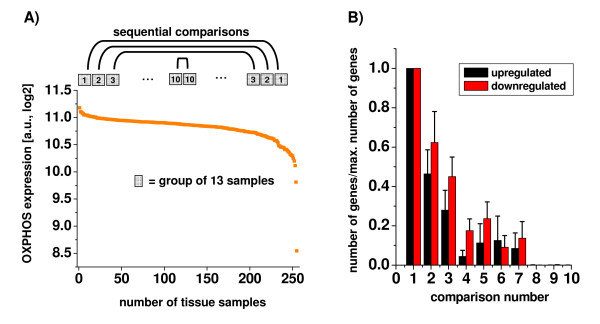
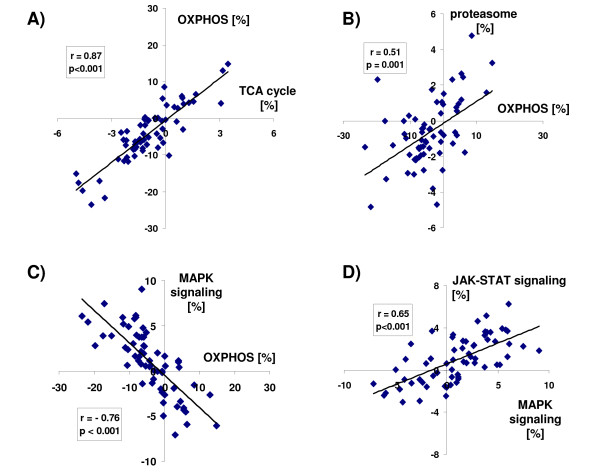
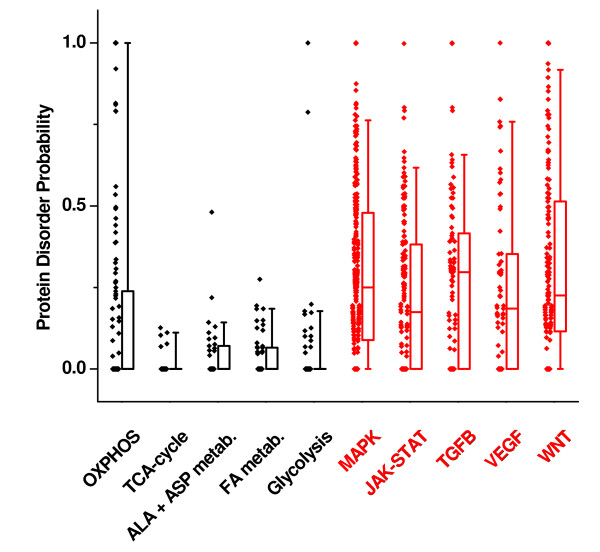
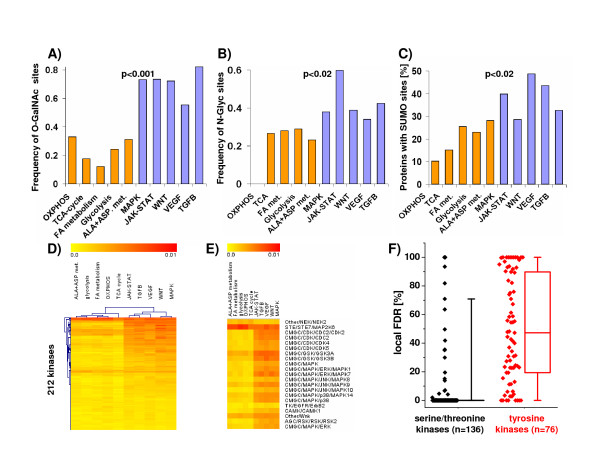
Results: Using a large-scale analysis of more than 40 microarray studies encompassing ~2400 mammalian tissue samples, we identified a common theme across heterogeneous microarray studies evident by a robust genome-wide inverse regulation of metabolic and cell signaling pathways: We found that upregulation of cell signaling pathways was invariably accompanied by downregulation of cell metabolic transcriptional activity (and vice versa). Several findings suggest that this characteristic gene expression pattern represents a new principle of mammalian transcriptional regulation. First, this coordinated transcriptional pattern occurred in a wide variety of physiological and pathophysiological conditions and was identified across all 20 human and animal tissue types examined. Second, the differences in metabolic gene expression predicted the magnitude of differences for signaling and all other pathways, i.e. tissue samples with similar expression levels of metabolic transcripts did not show any differences in gene expression for all other pathways. Third, this transcriptional pattern predicted a profound effect on the proteome, evident by differences in structure, stability and post-translational modifications of proteins belonging to signaling and metabolic pathways, respectively.

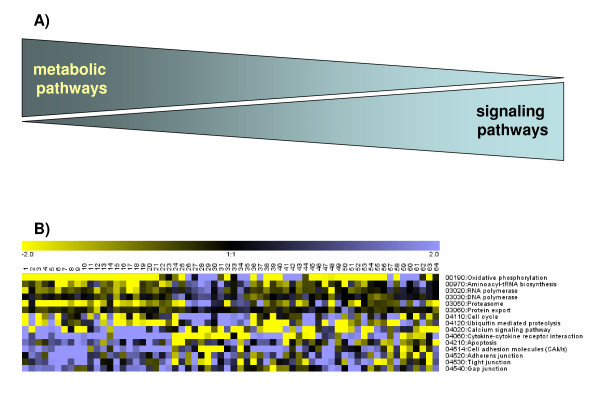
Conclusions: Our data suggest that in a wide range of physiological and pathophysiological conditions, gene expression changes exhibit a recurring pattern along a transcriptional axis, characterized by an inverse regulation of major metabolic and cell signaling pathways. Given its widespread occurrence and its predicted effects on protein structure, protein stability and post-translational modifications, we propose a new principle for transcriptional regulation in mammalian biology.


Figures

Figure 1
Figure 1
(A) and (B). Inverse regulation of major metabolic and cell signaling KEGG pathways. For 20 different human tissues, KEGG pathways were compared between the ten samples displaying the highest and the lowest values of OXPHOS gene expression (study and sample characteristics are listed in Additional Files 2 and 3). The directional regulation of 200 major KEGG pathways (number of up- minus down-regulated genes in a given KEGG pathway normalized to the total number of regulated genes within a study) was color-coded with yellow and blue representing low and high expression of the pathways, respectively. KEGG pathways were then sorted according to their similarity to "oxidative phosphorylation" which is represented by the first row (labeled OXPHOS). Metabolic pathways were consistently positively correlated with each other and negatively correlated with the expression of cell signaling pathways. ALA+ASP metabolism = alanine and aspartate metabolism.
Figure 2
Figure 2
(A) and (B). Sequential comparisons of tissue samples with highest vs. lowest OXPHOS expression. In five large microarray datasets (≥ 180 samples each; GSE5406 myocardium, GSE10780 breast tissue, GSE11223 colon, GSE11375 blood mononuclear cells, GEO13507 bladder tissue, Additional File 2), samples were first ranked according to the average expression of all genes belonging to the KEGG pathways of oxidative phosphorylation (OXPHOS). Then, gene expression was compared between group of samples containing between 10 and 13 tissue samples (depending on the size of the dataset) with the highest and lowest OXPHOS expression, the second-highest and second-lowest OXPHOS expression, and so on, using Significance Analysis of Microarrays (SAM) with a false discovery rate (FDR) of 5%. The largest differences were observed for the samples with the highest and lowest OXPHOS gene expression (comparison "1"). For the remaining comparisons (numbered "2"-"10"), the number of differentially expressed transcripts declined rapidly and was zero for samples showing only minor differences in OXPHOS expression levels (comparisons "8"-"10"). Panel B shows the mean ± SEM of all five datasets.
Figure 3
Figure 3
Correlation of KEGG pathway gene expression. There is a positive correlation between OXPHOS and TCA ('citrate') cycle (A) and between the KEGG pathways of OXPHOS and proteasome (B). OXPHOS and MAPK signaling pathways are negatively correlated (C), while signaling pathways (e.g. JAK-STAT and MAPK) are positively correlated to each other (D). Plots represent net direction of regulation of a KEGG pathway, i.e. number of up- minus down-regulated genes in relation to the total number of regulated genes within a study. Correlation plots include all 64 animal and human myocardial microarray studies listed in Additional File 2.
Figure 4
Figure 4
Patterns of pathway regulation. (A) A schematic of reciprocal correlation of metabolic and signaling pathways in mammalian transcription. (B) Relation of major KEGG pathways to OXPHOS. The directional regulation of 14 major KEGG pathways (number of up- minus down-regulated genes in a given KEGG pathway normalized to the total number of regulated genes within a study) was color-coded with yellow and blue representing low and high expression of the pathways, respectively. The cellular pathways of "protein export", "cell cycle" and ubiquitin-mediated proteolysis" were positively correlated with OXPHOS, while "calcium-mediated signaling", and structural components important for cell-cell contact (e.g. "cell adhesion molecules", "tight junctions", "gap junctions", "adherens junctions") were negatively correlated with OXPHOS.
Figure 5
Figure 5
Disorder Probability of Proteins of KEGG pathways. KEGG pathways for metabolic genes were more likely to consist of proteins with a higher degree of order, whereas signal transduction pathways include proteins with a higher degree of disorder (p < 0.01, Wilcoxon-test). For each KEGG pathway, boxplots delineate the median value as well as the 25th and 75th percentiles. Raw data, i.e. score representing protein disorder probability (0 and 1 representing low and high degree of disorder, respectively) are plotted as diamonds next to the boxplots. ALA+ASP metabolism = alanine and aspartate metabolism.
Figure 6
Figure 6
Post-translational modifications in 5 metabolic vs. 5 signaling pathways. (A) Predicted mucin-type O-glycosylation (O-GalNAc), (B) N-glycosylation and (C) SUMOylation (Small Ubiquitin-like Modifier) sites are more frequent in signaling (blue bars) vs. metabolic pathways (orange bars). (D)-(F) Predicted frequency of 212 kinase phosphorylation sites (normalized to number and length of proteins within a given pathway to enable comparison across groups). Panel D represents a hierarchical clustering using all 212 kinases (Euclidean distance); the predicted frequency of a given kinase phosphorylation site is color-coded with yellow and red representing low and high expression, respectively. Panel E highlights 21 kinases from Panel D. Only two kinase phosphorylation sites were found to be enriched in metabolic pathways (NEK2 and MAPK2K6). (F) Signaling pathways showed a statistically significant overrepresentation of serine/threonine phosphorylation sites, and to a lesser degree tyrosine phosphorylation sites compared to metabolic pathways (p < 0.01, Wilcoxon-test). For each KEGG pathway, boxplots delineate the median value as well as the 25th and 75th percentiles. The raw data, i.e. individual values for local FDR for the comparison of 5 metabolic vs. 5 signaling pathways are plotted as diamonds next to the boxplots.

References

    1. Barth AS, Aiba T, Halperin V, DiSilvestre D, Chakir K, Colantuoni C, Tunin RS, Dimaano VL, Yu W, Abraham TP. et al. Cardiac resynchronization therapy corrects dyssynchrony-induced regional gene expression changes on a genomic level. Circ Cardiovasc Genet. 2009;2(4):371–378. doi: 10.1161/CIRCGENETICS.108.832345. - DOI - PMC - PubMed
    1. Kanehisa M, Goto S. KEGG: Kyoto Encyclopedia of Genes and Genomes. Nucleic Acids Res. 2000;28(1):27–30. doi: 10.1093/nar/28.1.27. - DOI - PMC - PubMed
    1. Tusher VG, Tibshirani R, Chu G. Significance analysis of microarrays applied to the ionizing radiation response. Proc Natl Acad Sci USA. 2001;98(9):5116–5121. doi: 10.1073/pnas.091062498. - DOI - PMC - PubMed
    1. Kriwacki RW, Hengst L, Tennant L, Reed SI, Wright PE. Structural studies of p21Waf1/Cip1/Sdi1 in the free and Cdk2-bound state: conformational disorder mediates binding diversity. Proc Natl Acad Sci USA. 1996;93(21):11504–11509. doi: 10.1073/pnas.93.21.11504. - DOI - PMC - PubMed
    1. Uversky VN, Oldfield CJ, Dunker AK. Intrinsically disordered proteins in human diseases: introducing the D2 concept. Annu Rev Biophys. 2008;37:215–246. doi: 10.1146/annurev.biophys.37.032807.125924. - DOI - PubMed

Publication types

LinkOut - more resources