. 2010 Mar 24:11:40.
doi: 10.1186/1471-2202-11-40.

Temporo-insular enhancement of EEG low and high frequencies in patients with chronic tinnitus. QEEG study of chronic tinnitus patients

Affiliations

Temporo-insular enhancement of EEG low and high frequencies in patients with chronic tinnitus. QEEG study of chronic tinnitus patients

Morteza Moazami-Goudarzi et al. BMC Neurosci. .

Abstract

Background: The physiopathological mechanism underlying the tinnitus phenomenon is still the subject of an ongoing debate. Since oscillatory EEG activity is increasingly recognized as a fundamental hallmark of cortical integrative functions, this study investigates deviations from the norm of different resting EEG parameters in patients suffering from chronic tinnitus.

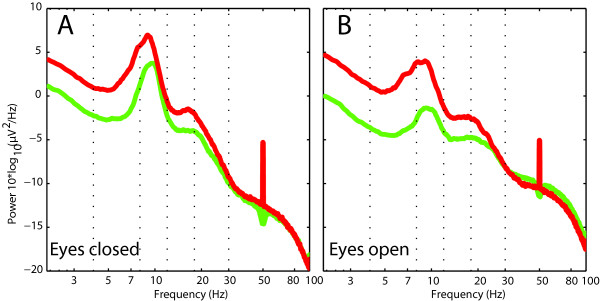
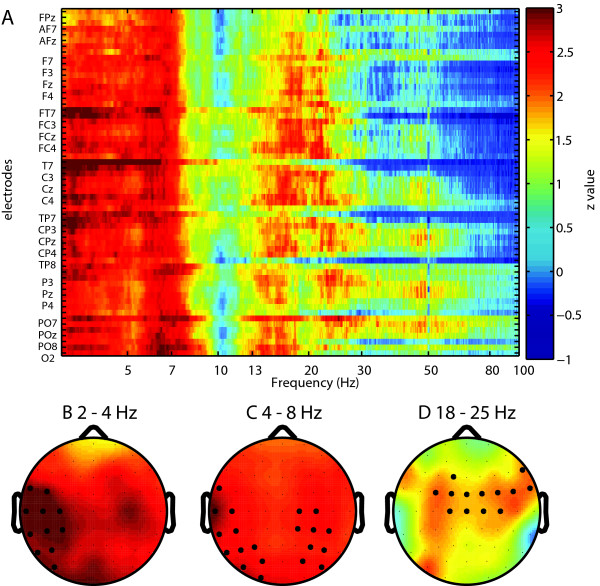
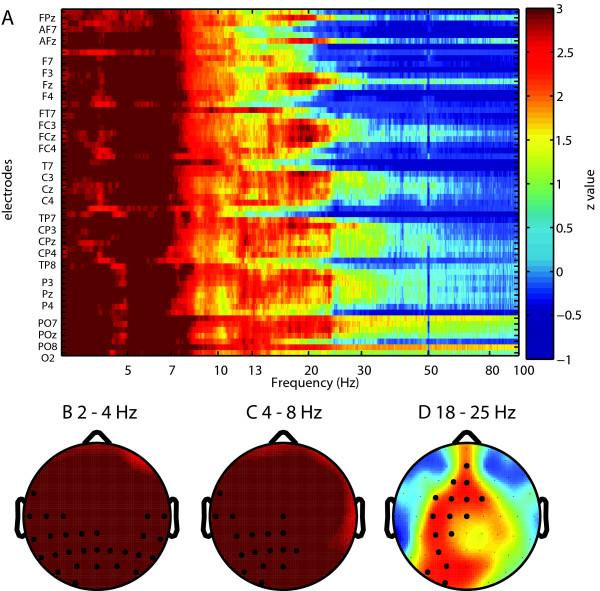
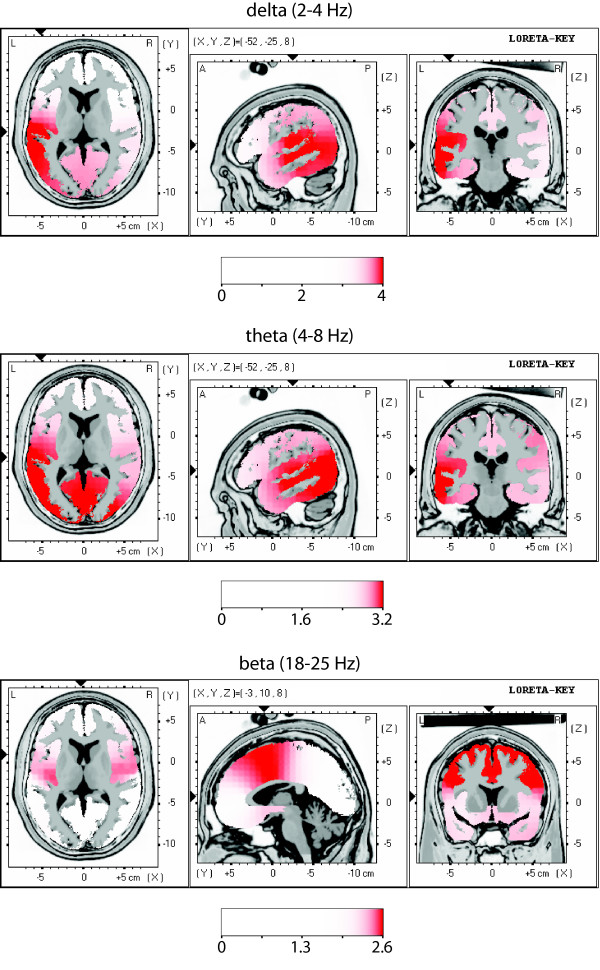
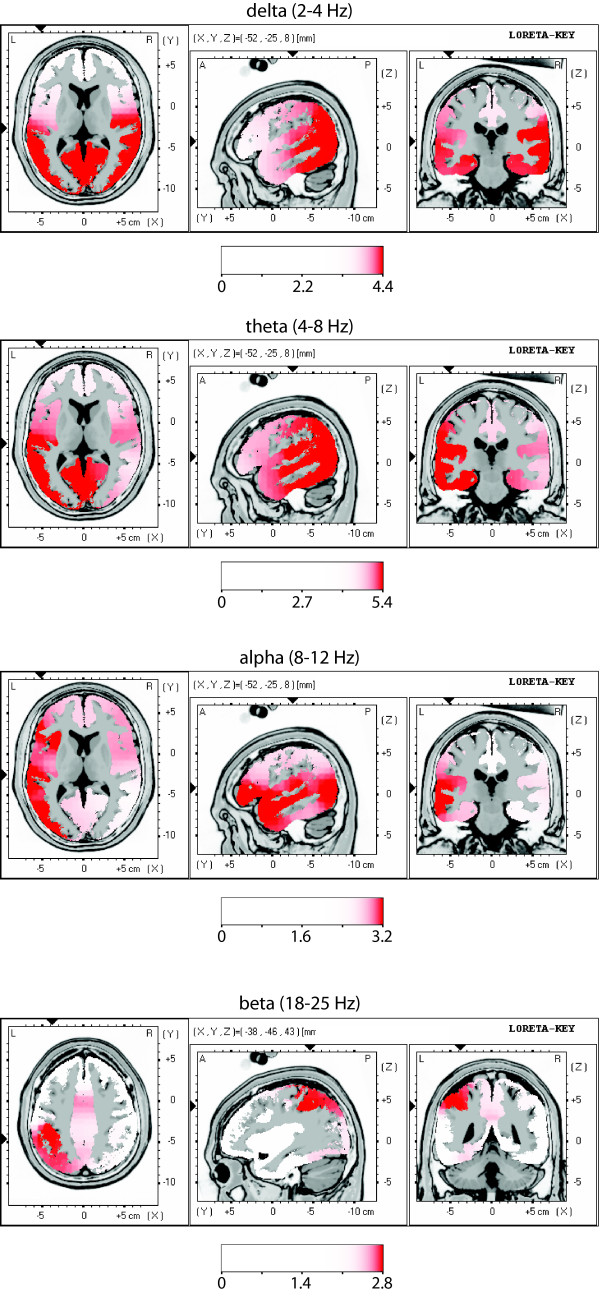
Results: Spectral parameters of resting EEG of male tinnitus patients (n = 8, mean age 54 years) were compared to those of age-matched healthy males (n = 15, mean age 58.8 years). On average, the patient group exhibited higher spectral power over the frequency range of 2-100 Hz. Using LORETA source analysis, the generators of delta, theta, alpha and beta power increases were localized dominantly to left auditory (Brodmann Areas (BA) 41,42, 22), temporo-parietal, insular posterior, cingulate anterior and parahippocampal cortical areas.

Conclusions: Tinnitus patients show a deviation from the norm of different resting EEG parameters, characterized by an overproduction of resting state delta, theta and beta brain activities, providing further support for the microphysiological and magnetoencephalographic evidence pointing to a thalamocortical dysrhythmic process at the source of tinnitus. These results also provide further confirmation that reciprocal involvements of both auditory and associative/paralimbic areas are essential in the generation of tinnitus.


Figures

Figure 1
Figure 1
Enhanced EEG power in tinnitus patients. In global EEG power spectrum for the group of patients (red) was enhanced with respect to the group of healthy controls (green) in A and B for EC and EO conditions respectively.
Figure 2
Figure 2
Electrodewise comparison of power spectra for EC condition. (A) Shown are Z-values for each electrode and frequency point (Wilcoxon rank sum tests). Non-corrected Z values above 1.96 correspond to p < 0.05. Highly significant electrodes were marked with black circles at different p values. (B) Delta (2-4 Hz) band (corrected, p < 0.004). (C) Theta (4-8 Hz) band (corrected, p < 0.016). (D) Beta (18-25 Hz) band (corrected, p < 0.05).
Figure 3
Figure 3
Electrodewise comparison of power spectra for EO condition. (A) Shown are Z-values for each electrode and frequency point (Wilcoxon rank sum tests). Non-corrected Z values above 1.96 correspond to p < 0.05. Highly significant electrodes were marked with black circles at different p values. (B) Delta (2-4 Hz) band (corrected, p < 0.0019). (C) Theta (4-8 Hz) band (corrected, p < 0.001). (D) Beta (18-25 Hz) band (corrected, p < 0.05).
Figure 4
Figure 4
Comparison of functional tomographic maps for EC condition. LORETA functional images show differences in regional brain activity between patient group and healthy control group for three frequency ranges. For each frequency range, three orthogonal slices through the location of maximal increase are displayed. Images are colour coded (p < 0.05, corrected for multiple comparison; linearity = 75) registered to the stereotaxic Talairach space, and overlaid on a structural MRI scan. The MNI (Montreal Neurological Institute) coordinates are given on the slice maps. At cortical voxels, t values are colour coded according to the scale bar. Red areas correspond to overactivation in the patient group. Centre of overactivity for delta: BA 41, 42, 22, insula and 21; for theta: 41, 42, 22, insula, 23, 29, 30 and 21; for beta: insula, BA 24, 32, 6 and 9.
Figure 5
Figure 5
Comparison of functional tomographic maps for EO condition for four frequency bands. Center of overactivity for delta: BA 41, 42, 22, 23, 29, 30, insula, 21, parahippocampal gyrus; for theta: BA 41, 42, 22, 23, 29, 30, insula, 21, parahippocampal gyrus; for alpha: BA 41, 42, 22, insula, 21, prefrontal; for beta: BA 40.
Figure 6
Figure 6
Diagram of TC circuits. Panels A, B and C show three TC modules which we consider to be identical [7]. Module A is depicted in more detail [30]. One module includes, first, cortical layers (I, IV, V and VI) with pyramidal cells and one grey GABAergic inhibitory cell; second, nucleus reticularis (RT, grey GABAergic inhibitory cells); and third, thalamus (TH), represented by one specific cell in medial geniculate body (MGB) and one non-specific cell (e.g. in CL). The specific thalamic cell projects to the apical dendrites of both layers V and VI pyramidal cells and collaterals sustain reticular feedback and cortical feed-forward inhibitions. The non-specific thalamic cell projects to RT and to the layer V pyramidal neuron and has a divergent connection onto the neighboring module. The corticothalamic feedback connection is depicted as intramodular onto RT and its thalamic relay cell, and divergent intra- and cross-modular onto 3 thalamic relay cells. There are also divergent cross-modular reticulothalamic projections. Arrows 1, 2 and 3 indicate the sequence of 1) auditory deafferentation, 2) theta cross-modular spread, and 3) beta activation edge.

Similar articles

Cited by

References

    1. Jastreboff PJ. Phantom auditory perception (tinnitus): mechanisms of generation and perception. Neurosci Res. 1990;8(4):221–254. doi: 10.1016/0168-0102(90)90031-9. - DOI - PubMed
    1. Heller AJ. Classification and epidemiology of tinnitus. Otolaryngologic clinics of North America. 2003;36:239–248. doi: 10.1016/S0030-6665(02)00160-3. - DOI - PubMed
    1. Hoffman H, Reed G. In: Epidemiology of tinnitus. Snow JB, editor. Lewiston, NY: B C Decker; 2004. Tinnitus: Theory and Management; pp. 16–41.
    1. Eggermont JJ, Roberts LE. The neuroscience of tinnitus. Trends Neurosci. 2004;27(11):676–682. doi: 10.1016/j.tins.2004.08.010. - DOI - PubMed
    1. Norena A, Micheyl C, Chery-Croze S, Collet L. Psychoacoustic characterization of the tinnitus spectrum: implications for the underlying mechanisms of tinnitus. Audiology & neuro-otology. 2002;7:358–369. - PubMed

Publication types

MeSH terms