. 2010 May 14;285(20):14861-14870.
doi: 10.1074/jbc.M109.099879. Epub 2010 Mar 24.

Protein-tyrosine phosphatase PTPN9 negatively regulates ErbB2 and epidermal growth factor receptor signaling in breast cancer cells

Affiliations

Protein-tyrosine phosphatase PTPN9 negatively regulates ErbB2 and epidermal growth factor receptor signaling in breast cancer cells

Taichang Yuan et al. J Biol Chem. .

Abstract

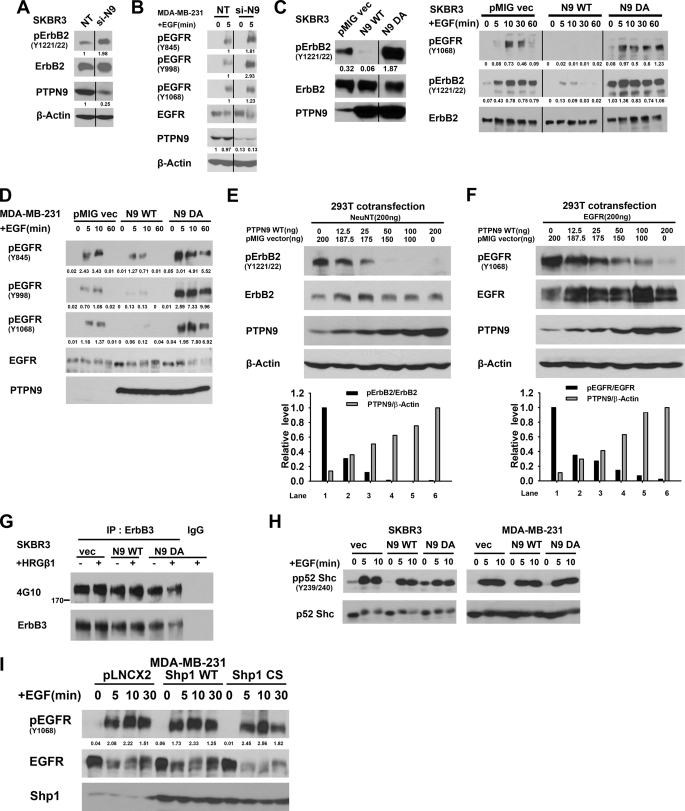
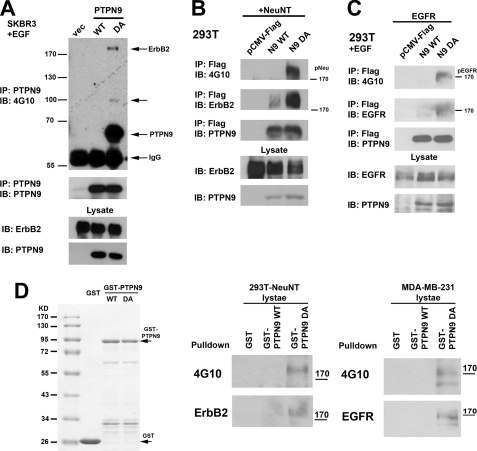
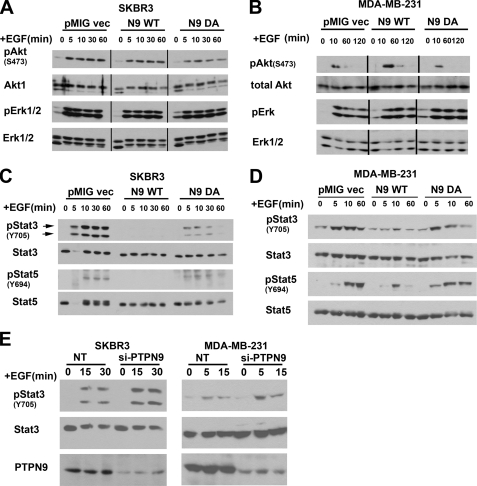
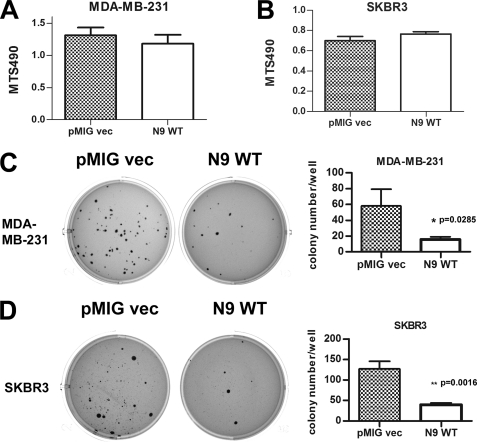
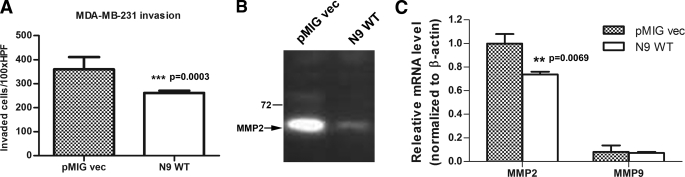
ErbB family of the receptor protein-tyrosine kinase plays an important role in the progression of human cancers including breast cancer. Finding protein-tyrosine phosphatase (PTPs) that can specifically regulate the function of ErbB should help design novel therapies for treatment. By performing a small interfering RNA screen against 43 human PTPs, we find that knockdown of protein-tyrosine phosphatase PTPN9 significantly increases ErbB2 tyrosyl phosphorylation in the SKBR3 breast cancer cell line. In addition, knockdown of PTPN9 expression also enhances tyrosyl phosphorylation of the ErbB1/epidermal growth factor receptor (EGFR) in the MDA-MB-231 breast cancer cell line. Conversely, increasing expression of PTPN9 wild type (WT) inhibits tyrosyl phosphorylation of ErbB2 and EGFR. To test whether ErbB2 and EGFR are substrates of PTPN9, PTPN9 WT, and a substrate trapping mutant (PTPN9 DA) are overexpressed in SKBR3 and MDA-MB-231 cells. Compared with vector control, expression of PTPN9 WT significantly inhibits whereas expression of PTPN9 DA dramatically enhances tyrosyl phosphorylation of ErbB2 and EGFR, respectively. In contrast, expression of PTPN9 WT or DA mutant does not affect tyrosyl phosphorylation of ErbB3 and Shc. Importantly, coimmunoprecipitation and glutathione S-transferase fusion protein pulldown experiments show that tyrosol-phosphorylated ErbB2 or EGFR is preferentially associated with PTPN9 DA compared with PTPN9 WT, indicating that ErbB2 and EGFR are substrates of PTPN9. Furthermore, PTPN9 WT expression specifically impairs EGF-induced STAT3 and STAT5 activation, and inhibits the cell growth in soft agar. Last, PTPN9 WT expression also reduces invasion and MMP2 expression of MDA-MB-231 cells. Our data suggest PTPN9 as a negative regulator of breast cancer cells by targeting ErbB2 and EGFR and inhibiting STAT activation.


Figures

FIGURE 1.
FIGURE 1.
PTPN9 regulates tyrosyl phosphorylation of ErbB2 and EGFR. A and B, PTPN9 knockdown enhances tyrosyl phosphorylation of ErbB2 and EGFR. SKBR3 (A) and MDA-MB-231 (B) cells were transfected with the non-target control siRNA (NT) and PTPN9 siRNA (si-PTPN9) oligos. Two days later, MDA-MB-231 cells were starved and stimulated with 25 ng/ml of EGF. Equal amounts of cell lysates were immunoblotted with the indicated antibodies (B). C and D, overexpression of PTPN9 inhibits EGF-induced tyrosyl phosphorylation of ErbB2 and EGFR in breast cancer cells. SKBR3 (C) and MDA-MB-231 (D) cells stably expressing pMIG vector control, PTPN9 WT, and PTPN9 DA by retroviral infections were randomly grown (C, left panel) or starved and stimulated with 25 ng/ml of EGF for the indicated times, lysed, and immunoblotted with antibodies against pErbB2 (Y1221/22), pEGFR (Y845, Y998, Y1068) and reprobed with antibodies against ErbB2, EGFR, and PTPN9. E and F, increasing expression of PTPN9 inhibits tyrosyl phosphorylation of NeuNT and EGFR. 293T cells were transiently cotransfected with vector (200 ng) expressing NeuNT (E) or EGFR (F) together with pMIG vector alone, and the indicated increasing amounts (0–200 ng) of pMIG expressing PTPN9 WT. 293T cells cotransfected with EGFR and PTPN9 were stimulated with 25 ng/ml of EGF for 10 min before cell lysis. Equal amounts of lysates were immunoblotted with the indicated antibodies (top panels). Densitometry was used to quantify bands in Western blots (bottom panels). The ratio of the pErbB2/total ErbB2 or pEGFR/total EGFR in pMIG vector control cells is arbitrarily set to 1 (lane 1). The ratio of PTPN9/β-actin in pMIG-PTPN9 (200 ng) of transfected cells is arbitrarily set to 1 (lane 6). G, overexpression of PTPN9 WT does not affect tyrosyl phosphorylation of ErbB3. The same SKBR3 cells used in C were starved, and stimulated with 5 ng/ml of heregulin (HRGβ1). Equal amounts of lysates were immunoprecipitated (IP) with anti-ErbB3 antibodies, immunoblotted with anti-phosphotyrosine antibody (4G10), and reprobed with anti-ErbB3 antibodies. H, overexpression of PTPN9 WT does not affect tyrosyl phosphorylation of Shc. The same SKBR3 cells used in C were starved and stimulated with EGF. Equal amounts of lysates were immunoblotted with anti-pShc (Y239/240) antibodies and reprobed with anti-Shc antibodies. I, overexpression of Shp-1 does not affect tyrosyl phosphorylation of EGFR. MDA-MB-231 cells stably expressing pLNCX2 vector alone, and pLNCX2 expressing Shp-1 WT and CS mutant by retroviral infection were starved and stimulated with 25 ng/ml of EGF. Equal amounts of lysates were immunoblotted with the pEGFR (Y1068) antibodies and reprobed with anti-EGFR antibodies. Densitometry was used to quantify bands in Western blots (Fig. 1, A–D and I). Numbers under the pErbB2 or pEGFR blots show the ratios of pErbB2/total ErbB2 or pEGFR/total EGFR. Numbers under the PTPN9 blots show the ratios of PTPN9/β-actin. Data shown in this figure are representative from at least three independent experiments.
FIGURE 2.
FIGURE 2.
PTPN9 substrate trapping mutant DA associates with tyrosyl-phosphorylated ErbB2 and EGFR. A and B, PTPN9 DA co-immunoprecipitates with tyrosyl-phosphorylated ErbB2. Lysates from SKBR3 cells stably expressing vector alone (vec), PTPN9 WT, and PTPN9 DA (A), and 293T cells transiently cotransfected with NeuNT together with pCMV-FLAG vector alone, FLAG-tagged PTPN9 WT, and FLAG-tagged PTPN9 DA (B) were immunoprecipitated (IP) with anti-PTPN9 antibodies (A) and anti-FLAG antibody (B), and immunoblotted (IB) with the indicated antibodies. C, PTPN9 DA co-immunoprecipitates with tyrosine-phosphorylated EGFR. 293T cells cotransfected with the pEGFP-EGFR plasmid together with pCMV-FLAG vector alone, FLAG-tagged PTPN9 WT, and FLAG-tagged PTPN9 DA were starved, stimulated with 25 ng/ml of EGF for 5 min, lysed, immunoprecipitated with anti-FLAG antibody, and immunoblotted with the indicated antibodies. D, GST-PTPN9 DA fusion protein pulls down tyrosyl-phosphorylated ErbB2 or EGFR. Glutathione-agarose beads containing equal amounts of GST alone, GST-PTPN9 WT, and GST-PTPN9 DA proteins were resolved by SDS-PAGE and stained with Coomassie Blue (left panel), or incubated with equal amounts of cells lysates from 293T cells transiently transfected with NeuNT (middle panel) or MDA-MB-231 cells stimulated with EGF for 10 min (right panel), washed, and immunoblotted with the indicated antibodies. Data shown in this figure are representative results from two independent experiments.
FIGURE 3.
FIGURE 3.
Expression of PTPN9 specifically inhibits EGF-induced STAT3 and STAT5 activation. A and B, expression of PTPN9 WT does not inhibit EGF-induced activation of ERK and Akt. SKBR3 (A) and MDA-231 (B) cells stably expressing pMIG vector, PTPN9 WT, and PTPN9 DA (same as used in Fig. 1, C and D) were starved, stimulated with 25 ng/ml of EGF for the indicated times, lysed, immunoblotted with antibodies against pERK1/2, pAkt (Ser473), and reprobed with antibodies against ERK1/2, Akt, and PTPN9. C and D, expression of PTPN9 WT inhibits EGF-induced STAT3, and STAT5 in SKBR3 and MDA-MB-231 cells. The same SKBR3 (C) and MDA-231 (D) cells used in A and B, respectively, were starved, stimulated with 25 ng/ml of EGF for the indicated times, lysed, and immunoblotted with antibodies against the indicated pSTAT3 (Y705) and pSTAT5 (Y694), and reprobed with antibodies against STAT3 and STAT5. Shown (A–D) are the representative results from three independent experiments. E, PTPN9 knockdown enhances EGF-induced STAT3 activation. SKBR3 (left) and MDA-MB-231 (right) cells were transfected with control (NT) and si-PTPN9 oligos, starved, and stimulated with 25 ng/ml of EGF for the indicated times. Equal amounts of lysates were immunoblotted with anti-pSTAT3 antibodies and reprobed with anti-STAT3 and anti-PTPN9 antibodies. Shown here is the representative result from two independent experiments.
FIGURE 4.
FIGURE 4.
PTPN9 overexpression inhibits the growth of MDA-MB-231 and SKBR3 cells in soft agar assay. A and B, PTPN9 overexpression does not affect cell growth in tissue culture plastic plates. MDA-MB-231 (A) and SKBR3 (B) cells expressing pMIG vector and PTPN9 WT were grown in tissue culture plates for 3 days in medium containing 10% FBS. Viable cells were assayed using MTS reagent. Shown are representative results from at least three independent experiments. C and D, PTPN9 overexpression inhibits cell growth in soft agar assay. MDA-MB-231 (C) and SKBR3 (D) cells expressing pMIG vector and PTPN9 WT were grown in medium containing 10% FBS and 0.25% agar for 3 weeks. Plates were stained, photographed (C and D, left panels), and visible colonies were counted (C and D, right panels). Representative results in triplicate from two independent experiments are depicted as mean ± S.D.
FIGURE 5.
FIGURE 5.
PTPN9 overexpression inhibits invasion and MMP2 expression in MDA-MB-231 cells. A, MDA-MB-231 cells expressing pMIG vector and PTPN9 WT were subjected to the transwell invasion assay. Shown is the representative result from three independent experiments. B, expression of PTPN9 inhibits the MMP2 activity. Equal number of MDA-MB-231 cells expressing pMIG vector and PTPN9 WT were cultured in medium without FBS for 48 h. Equal volumes of the cultured medium from both cell lines were subjected to gelatin zymography. The arrow indicates the position of the active MMP2. C, expression of PTPN9 inhibits MMP2 mRNA expression. Total RNAs from MDA-MB-231 cells expressing pMIG vector and PTPN9 WT were isolated and reversed transcribed. MMP2 and MMP9 mRNA expression levels were measured by quantitative PCR. The levels of MMP2 and MMP9 mRNA were normalized to β-actin and expressed as relative mRNA compared with MMP2 mRNA in pMIG vector control. Representative results from two independent experiments each run at least in triplicate are shown as mean ± S.D.

Similar articles

Cited by

References

    1. Hynes N. E., Lane H. A. (2005) Nat. Rev. Cancer 5, 341–354 - PubMed
    1. Campos S. M. (2008) Cancer Invest. 26, 757–768 - PubMed
    1. Hayes D. F., Thor A. D. (2002) Semin. Oncol. 29, 231–245 - PubMed
    1. Bièche I., Onody P., Tozlu S., Driouch K., Vidaud M., Lidereau R. (2003) Int. J. Cancer 106, 758–765 - PubMed
    1. Holbro T., Beerli R. R., Maurer F., Koziczak M., Barbas C. F., 3rd, Hynes N. E. (2003) Proc. Natl. Acad. Sci. U.S.A. 100, 8933–8938 - PMC - PubMed

Publication types