

The limited contribution of Fyn and Gab2 to the high affinity IgE receptor signaling in mast cells
- PMID: 20335178
- PMCID: PMC2871443
- DOI: 10.1074/jbc.M110.109413
The limited contribution of Fyn and Gab2 to the high affinity IgE receptor signaling in mast cells
Abstract
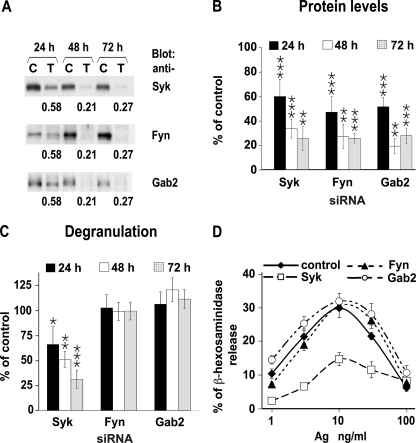
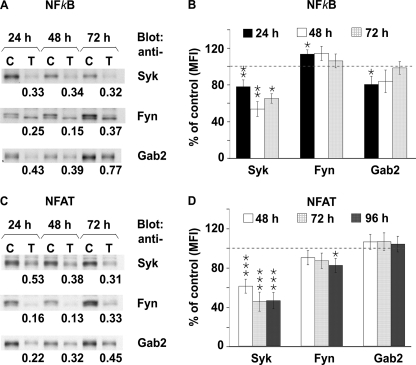
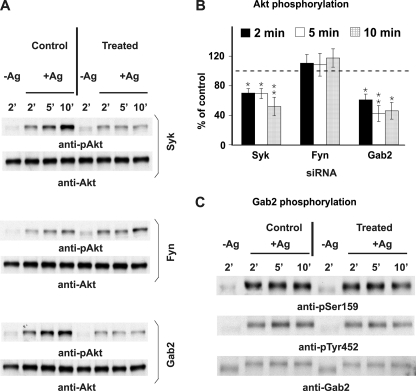
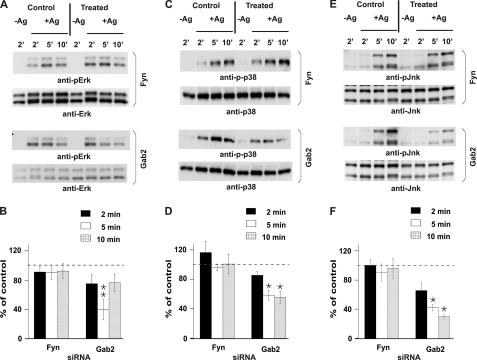
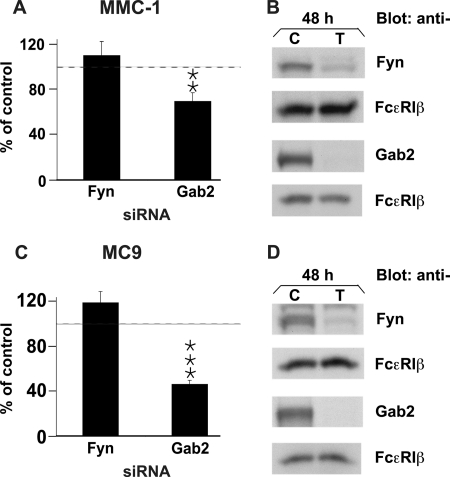
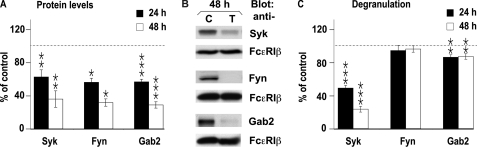
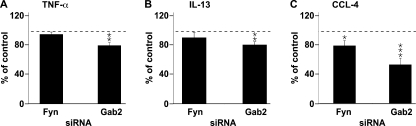
Several studies with mast cells from knock-out mice have suggested that the tyrosine kinase Fyn and its downstream substrate Gab2 may play a role in high affinity IgE receptor (FcepsilonRI)-mediated mast cell activation. To better understand the role of these two molecules and of Syk, we transiently transfected mast cells with small interference RNA (siRNA) targeted to Fyn, Gab2, or Syk to specifically decrease their expression. The siRNA suppression of Gab2 but not Fyn reduced activation of the phosphoinositide-3-kinase (PI3K) pathway as demonstrated by the change in phosphorylation of Akt; this indicates that Gab2 but not Fyn regulates this pathway. The decreased expression of Gab2 and Fyn had minor effects on degranulation. There were also some minor changes in activation of the NFAT or NFkappaB transcription factors in cells with reduced expression of Fyn or Gab2. Decreased Gab2 but not Fyn reduced the FcepsilonRI-induced activation of the Erk, Jnk, and p38 MAP kinases and the release of TNF-alpha. In contrast, decreased expression of Syk dramatically reduced FcepsilonRI-induced degranulation, activation of NFAT and NFkappaB. Therefore, the reduction in expression of these proteins in mast cells indicates that Syk is the major regulator of FcepsilonRI-mediated reactions, whereas Fyn has minor if any effects and Gab2 regulates primarily late events including MAP kinase activation and release of cytokines.
Figures
Similar articles
-
Mast cell signaling: the role of protein tyrosine kinase Syk, its activation and screening methods for new pathway participants.FEBS Lett. 2010 Dec 15;584(24):4933-40. doi: 10.1016/j.febslet.2010.08.006. Epub 2010 Aug 7. FEBS Lett. 2010. PMID: 20696166 Free PMC article. Review.
-
The Src family kinase Fgr is critical for activation of mast cells and IgE-mediated anaphylaxis in mice.J Immunol. 2011 Aug 15;187(4):1807-15. doi: 10.4049/jimmunol.1100296. Epub 2011 Jul 11. J Immunol. 2011. PMID: 21746961 Free PMC article.
-
Novel mechanism for Fc{epsilon}RI-mediated signal transducer and activator of transcription 5 (STAT5) tyrosine phosphorylation and the selective influence of STAT5B over mast cell cytokine production.J Biol Chem. 2012 Jan 13;287(3):2045-54. doi: 10.1074/jbc.M111.311142. Epub 2011 Nov 30. J Biol Chem. 2012. PMID: 22130676 Free PMC article.
-
Protein tyrosine phosphatase epsilon is a negative regulator of FcepsilonRI-mediated mast cell responses.Scand J Immunol. 2009 May;69(5):401-11. doi: 10.1111/j.1365-3083.2009.02235.x. Epub 2008 Feb 6. Scand J Immunol. 2009. PMID: 19508371
-
Protein-tyrosine kinases and adaptor proteins in FcepsilonRI-mediated signaling in mast cells.Curr Mol Med. 2003 Feb;3(1):85-94. doi: 10.2174/1566524033361618. Curr Mol Med. 2003. PMID: 12558077 Review.
Cited by
-
Inhibitory effect of oblongifolin C on allergic inflammation through the suppression of mast cell activation.Mol Cell Biochem. 2015 Aug;406(1-2):263-71. doi: 10.1007/s11010-015-2444-9. Epub 2015 May 13. Mol Cell Biochem. 2015. PMID: 25968068
-
Sirt1 negatively regulates FcεRI-mediated mast cell activation through AMPK- and PTP1B-dependent processes.Sci Rep. 2017 Jul 25;7(1):6444. doi: 10.1038/s41598-017-06835-3. Sci Rep. 2017. PMID: 28744004 Free PMC article.
-
Mast cell signaling: the role of protein tyrosine kinase Syk, its activation and screening methods for new pathway participants.FEBS Lett. 2010 Dec 15;584(24):4933-40. doi: 10.1016/j.febslet.2010.08.006. Epub 2010 Aug 7. FEBS Lett. 2010. PMID: 20696166 Free PMC article. Review.
-
TAK1 and IKK2, novel mediators of SCF-induced signaling and potential targets for c-Kit-driven diseases.Oncotarget. 2015 Oct 6;6(30):28833-50. doi: 10.18632/oncotarget.5008. Oncotarget. 2015. PMID: 26353931 Free PMC article.
-
The Src family kinase Fgr is critical for activation of mast cells and IgE-mediated anaphylaxis in mice.J Immunol. 2011 Aug 15;187(4):1807-15. doi: 10.4049/jimmunol.1100296. Epub 2011 Jul 11. J Immunol. 2011. PMID: 21746961 Free PMC article.
References
-
- Nadler M. J., Kinet J. P. (2002) Nat. Immunol. 3, 707–708 - PubMed
-
- Nadler M. J., Matthews S. A., Turner H., Kinet J. P. (2000) Adv. Immunol. 76, 325–355 - PubMed
-
- Kihara H., Siraganian R. P. (1994) J. Biol. Chem. 269, 22427–22432 - PubMed
-
- Siraganian R. P. (2003) Curr. Opin. Immunol. 15, 639–646 - PubMed
Publication types
MeSH terms
Substances
LinkOut - more resources
Full Text Sources
Molecular Biology Databases
Research Materials
Miscellaneous
