

Effects of pH and medullary blood flow on oxygen transport and sodium reabsorption in the rat outer medulla
- PMID: 20335320
- PMCID: PMC3433860
- DOI: 10.1152/ajprenal.00572.2009
Effects of pH and medullary blood flow on oxygen transport and sodium reabsorption in the rat outer medulla
Abstract
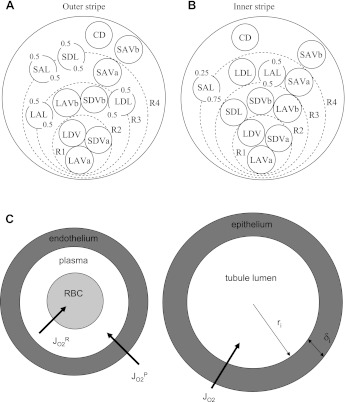
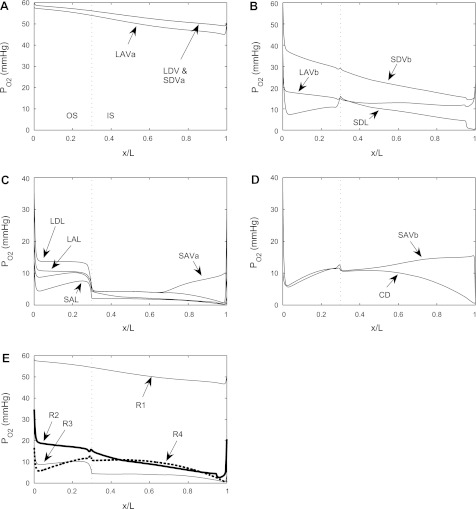
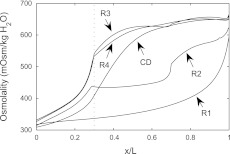
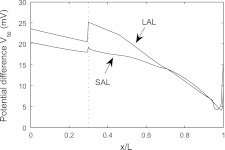
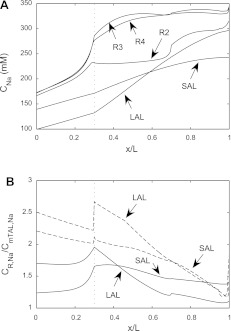
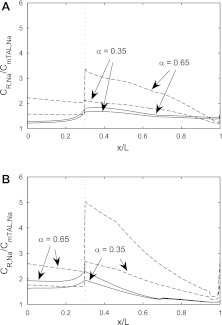
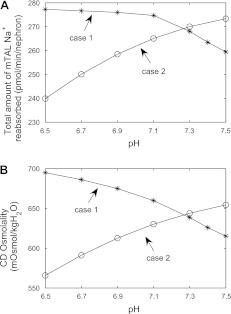
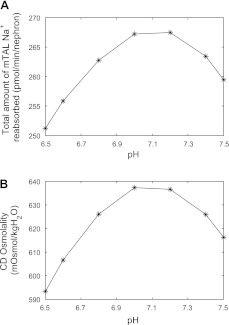
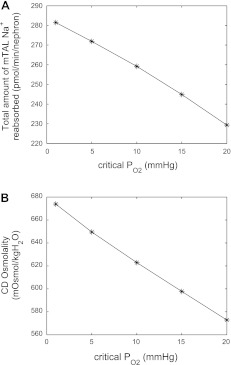
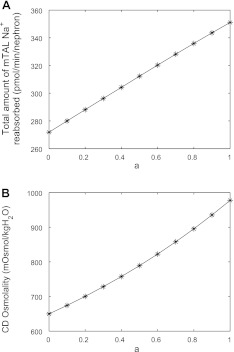
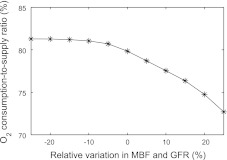
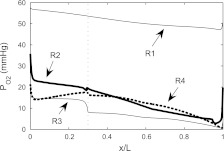
We used a mathematical model of O(2) transport and the urine concentrating mechanism of the outer medulla of the rat kidney to study the effects of blood pH and medullary blood flow on O(2) availability and Na(+) reabsorption. The model predicts that in vivo paracellular Na(+) fluxes across medullary thick ascending limbs (mTALs) are small relative to transcellular Na(+) fluxes and that paracellular fluxes favor Na(+) reabsorption from the lumen along most of the mTAL segments. In addition, model results suggest that blood pH has a significant impact on O(2) transport and Na(+) reabsorption owing to the Bohr effect, according to which a lower pH reduces the binding affinity of hemoglobin for O(2). Thus our model predicts that the presumed greater acidity of blood in the interbundle regions, where mTALs are located, relative to that in the vascular bundles, facilitates the delivery of O(2) to support the high metabolic requirements of the mTALs and raises the concentrating capability of the outer medulla. Model results also suggest that increases in vascular and tubular flow rates result in disproportional, smaller increases in active O(2) consumption and mTAL active Na(+) transport, despite the higher delivery of O(2) and Na(+). That is, at a sufficiently high medullary O(2) supply, O(2) demand in the outer medulla does not adjust precisely to changes in O(2) delivery.
Figures
Similar articles
-
A mathematical model of O2 transport in the rat outer medulla. II. Impact of outer medullary architecture.Am J Physiol Renal Physiol. 2009 Aug;297(2):F537-48. doi: 10.1152/ajprenal.90497.2008. Epub 2009 Apr 29. Am J Physiol Renal Physiol. 2009. PMID: 19403645 Free PMC article.
-
A mathematical model of O2 transport in the rat outer medulla. I. Model formulation and baseline results.Am J Physiol Renal Physiol. 2009 Aug;297(2):F517-36. doi: 10.1152/ajprenal.90496.2008. Epub 2009 Apr 29. Am J Physiol Renal Physiol. 2009. PMID: 19403646 Free PMC article.
-
Impact of renal medullary three-dimensional architecture on oxygen transport.Am J Physiol Renal Physiol. 2014 Aug 1;307(3):F263-72. doi: 10.1152/ajprenal.00149.2014. Epub 2014 Jun 4. Am J Physiol Renal Physiol. 2014. PMID: 24899054 Free PMC article.
-
AVP dynamically increases paracellular Na+ permeability and transcellular NaCl transport in the medullary thick ascending limb of Henle's loop.Pflugers Arch. 2017 Jan;469(1):149-158. doi: 10.1007/s00424-016-1915-5. Epub 2016 Dec 6. Pflugers Arch. 2017. PMID: 27924355 Review.
-
Molecular basis for active Na,K-transport by Na,K-ATPase from outer renal medulla.Biochem Soc Symp. 1985;50:59-79. Biochem Soc Symp. 1985. PMID: 2428372 Review.
Cited by
-
Modeling glucose metabolism and lactate production in the kidney.Math Biosci. 2017 Jul;289:116-129. doi: 10.1016/j.mbs.2017.04.008. Epub 2017 May 8. Math Biosci. 2017. PMID: 28495544 Free PMC article.
-
Quantifying retinal oxygenation and metabolism by phosphorescence lifetime imaging.Exp Eye Res. 2025 Aug;257:110422. doi: 10.1016/j.exer.2025.110422. Epub 2025 May 15. Exp Eye Res. 2025. PMID: 40381978 Review.
-
Inner retinal oxygen extraction fraction in rat.Invest Ophthalmol Vis Sci. 2013 Jan 21;54(1):647-51. doi: 10.1167/iovs.12-11305. Invest Ophthalmol Vis Sci. 2013. PMID: 23299486 Free PMC article.
-
Impact of nitric oxide-mediated vasodilation on outer medullary NaCl transport and oxygenation.Am J Physiol Renal Physiol. 2012 Oct;303(7):F907-17. doi: 10.1152/ajprenal.00055.2012. Epub 2012 Jul 11. Am J Physiol Renal Physiol. 2012. PMID: 22791340 Free PMC article.
-
Response of inner retinal oxygen extraction fraction to light flicker under normoxia and hypoxia in rat.Invest Ophthalmol Vis Sci. 2014 Sep 2;55(9):6055-8. doi: 10.1167/iovs.13-13811. Invest Ophthalmol Vis Sci. 2014. PMID: 25183761 Free PMC article.
References
-
- Adair GS. The hemoglobin system. VI. The oxygen dissociation curve of hemoglobin. J Biol Chem 63: 529–545, 1925
-
- Bagnasco S, Good D, Balaban R, Burg M. Lactate production in isolated segments of the rat nephron. Am J Physiol Renal Fluid Electrolyte Physiol 248: F522–F526, 1985 - PubMed
-
- Balaban RS, Soltoff SP, Storey JM, Mandel LJ. Improved renal cortical tubule suspension: spectrophotometric study of O2 delivery. Am J Physiol Renal Fluid Electrolyte Physiol 238: F50–F59, 1980 - PubMed
-
- Bouby N, Trinh-Trang-Tan M-M, Laouari D, Kleinknecht C, Grunfeld J-P, Kriz W, Bankir L, Doute M, Hahnel B, Coutaud C. Role of the urinary concentrating process in the renal effects of high protein intake. Kidney Int 34: 4–12, 1988 - PubMed
-
- Brezis M, Rosen S. Hypoxia of the renal medulla—its implications for disease. N Engl J Med 332: 647–655, 1995 - PubMed
Publication types
MeSH terms
Substances
Grants and funding
LinkOut - more resources
Full Text Sources