

Enzyme activity profiles during fruit development in tomato cultivars and Solanum pennellii
- PMID: 20335402
- PMCID: PMC2862428
- DOI: 10.1104/pp.110.154336
Enzyme activity profiles during fruit development in tomato cultivars and Solanum pennellii
Abstract
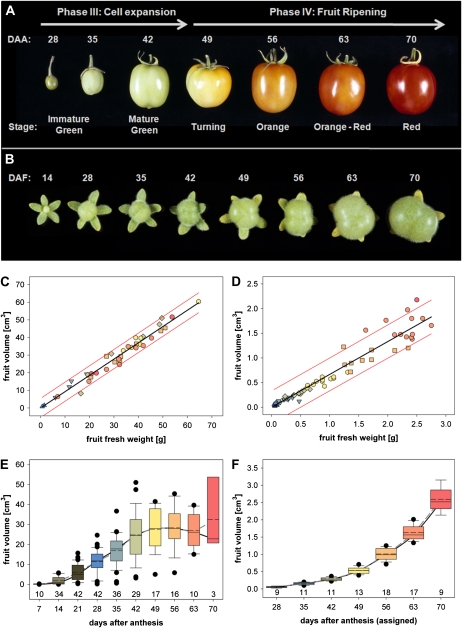
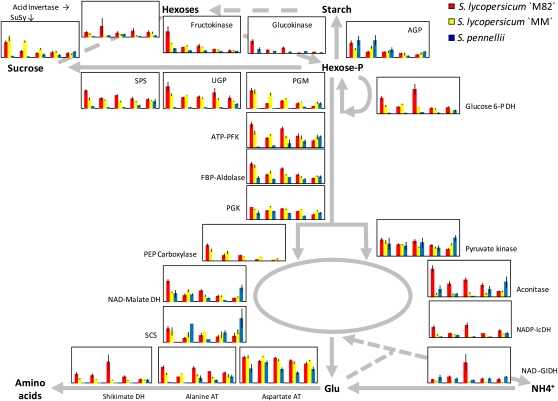
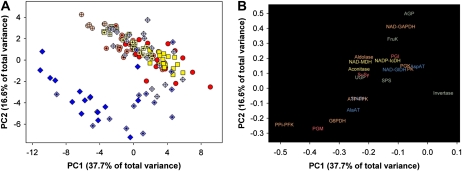
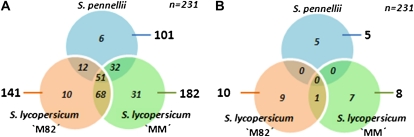
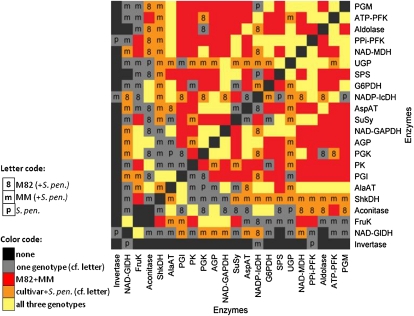
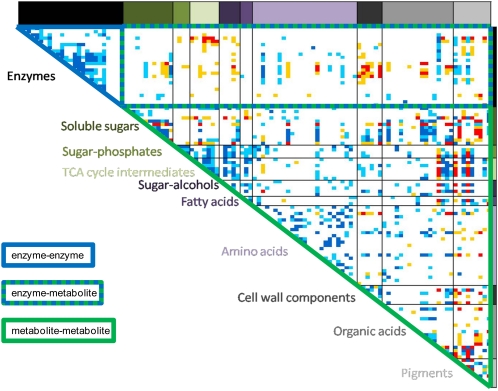
Enzymes interact to generate metabolic networks. The activities of more than 22 enzymes from central metabolism were profiled during the development of fruit of the modern tomato cultivar Solanum lycopersicum 'M82' and its wild relative Solanum pennellii (LA0716). In S. pennellii, the mature fruit remains green and contains lower sugar and higher organic acid levels. These genotypes are the parents of a widely used near introgression line population. Enzymes were also profiled in a second cultivar, S. lycopersicum 'Moneymaker', for which data sets for the developmental changes of metabolites and transcripts are available. Whereas most enzyme activities declined during fruit development in the modern S. lycopersicum cultivars, they remained high or even increased in S. pennellii, especially enzymes required for organic acid synthesis. The enzyme profiles were sufficiently characteristic to allow stages of development and cultivars and the wild species to be distinguished by principal component analysis and clustering. Many enzymes showed coordinated changes during fruit development of a given genotype. Comparison of the correlation matrices revealed a large overlap between the two modern cultivars and considerable overlap with S. pennellii, indicating that despite the very different development responses, some basic modules are retained. Comparison of enzyme activity, metabolite profiles, and transcript profiles in S. lycopersicum 'Moneymaker' revealed remarkably little connectivity between the developmental changes of transcripts and enzymes and even less between enzymes and metabolites. We discuss the concept that the metabolite profile is an emergent property that is generated by complex network interactions.
Figures
Similar articles
-
Remarkable reproducibility of enzyme activity profiles in tomato fruits grown under contrasting environments provides a roadmap for studies of fruit metabolism.Plant Physiol. 2014 Mar;164(3):1204-21. doi: 10.1104/pp.113.231241. Epub 2014 Jan 28. Plant Physiol. 2014. PMID: 24474652 Free PMC article.
-
Dynamic Metabolic Regulation by a Chromosome Segment from a Wild Relative During Fruit Development in a Tomato Introgression Line, IL8-3.Plant Cell Physiol. 2016 Jun;57(6):1257-70. doi: 10.1093/pcp/pcw075. Epub 2016 Apr 12. Plant Cell Physiol. 2016. PMID: 27076398
-
Identification of enzyme activity quantitative trait loci in a Solanum lycopersicum x Solanum pennellii introgression line population.Plant Physiol. 2011 Nov;157(3):998-1014. doi: 10.1104/pp.111.181594. Epub 2011 Sep 2. Plant Physiol. 2011. PMID: 21890649 Free PMC article.
-
Divergence in the enzymatic activities of a tomato and Solanum pennellii alcohol acyltransferase impacts fruit volatile ester composition.Mol Plant. 2015 Jan;8(1):153-62. doi: 10.1016/j.molp.2014.11.007. Epub 2014 Dec 11. Mol Plant. 2015. PMID: 25578279
-
Elucidating the functional role of endoreduplication in tomato fruit development.Ann Bot. 2011 May;107(7):1159-69. doi: 10.1093/aob/mcq257. Epub 2011 Jan 3. Ann Bot. 2011. PMID: 21199834 Free PMC article. Review.
Cited by
-
Metabolic analysis of kiwifruit (Actinidia deliciosa) berries from extreme genotypes reveals hallmarks for fruit starch metabolism.J Exp Bot. 2013 Nov;64(16):5049-63. doi: 10.1093/jxb/ert293. Epub 2013 Sep 21. J Exp Bot. 2013. PMID: 24058160 Free PMC article.
-
De-novo RNA sequencing and metabolite profiling to identify genes involved in anthocyanin biosynthesis in Korean black raspberry (Rubus coreanus Miquel).PLoS One. 2014 Feb 5;9(2):e88292. doi: 10.1371/journal.pone.0088292. eCollection 2014. PLoS One. 2014. PMID: 24505466 Free PMC article.
-
An update on source-to-sink carbon partitioning in tomato.Front Plant Sci. 2014 Oct 6;5:516. doi: 10.3389/fpls.2014.00516. eCollection 2014. Front Plant Sci. 2014. PMID: 25339963 Free PMC article. Review.
-
Development and Optimization of Solanum Lycocarpum Polyphenol Oxidase-Based Biosensor and Application towards Paracetamol Detection.Adv Pharm Bull. 2021 May;11(3):469-476. doi: 10.34172/apb.2021.054. Epub 2020 Jul 7. Adv Pharm Bull. 2021. PMID: 34513621 Free PMC article.
-
Genetic diversity, population structure and validation of SSR markers linked to Sw-5 and I-2 genes in tomato germplasm.Physiol Mol Biol Plants. 2021 Aug;27(8):1695-1710. doi: 10.1007/s12298-021-01037-8. Epub 2021 Jul 21. Physiol Mol Biol Plants. 2021. PMID: 34539111 Free PMC article.
References
-
- Baerenfaller K, Grossmann J, Grobei MA, Hull R, Hirsch-Hoffmann M, Yalovsky S, Zimmermann P, Grossniklaus U, Gruissem W, Baginsky S. (2008) Genome-scale proteomics reveals Arabidopsis thaliana gene models and proteome dynamics. Science 320: 938–941 - PubMed
-
- Baxter CJ, Carrari F, Bauke A, Overy S, Hill SA, Quick PW, Fernie AR, Sweetlove LJ. (2005a) Fruit carbohydrate metabolism in an introgression line of tomato with increased fruit soluble solids. Plant Cell Physiol 46: 425–437 - PubMed
-
- Baxter CJ, Sabar M, Quick WP, Sweetlove LJ. (2005b) Comparison of changes in fruit gene expression in tomato introgression lines provides evidence of genome-wide transcriptional changes and reveals links to mapped QTLs and described traits. J Exp Bot 56: 1591–1604 - PubMed
-
- Benjamini Y, Hochberg Y. (1995) Controlling the false discovery rate: a practical and powerful approach to multiple testing. J R Stat Soc B 57: 289–300
Publication types
MeSH terms
LinkOut - more resources
Full Text Sources
