. 2010 Mar 24;30(12):4197-209.
doi: 10.1523/JNEUROSCI.4187-09.2010.

Gap junctions/hemichannels modulate interkinetic nuclear migration in the forebrain precursors

Affiliations

Gap junctions/hemichannels modulate interkinetic nuclear migration in the forebrain precursors

Xiuxin Liu et al. J Neurosci. .

Abstract

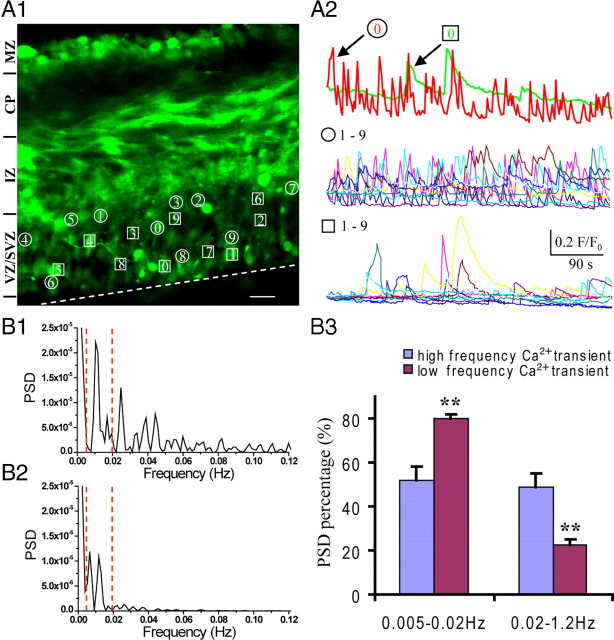
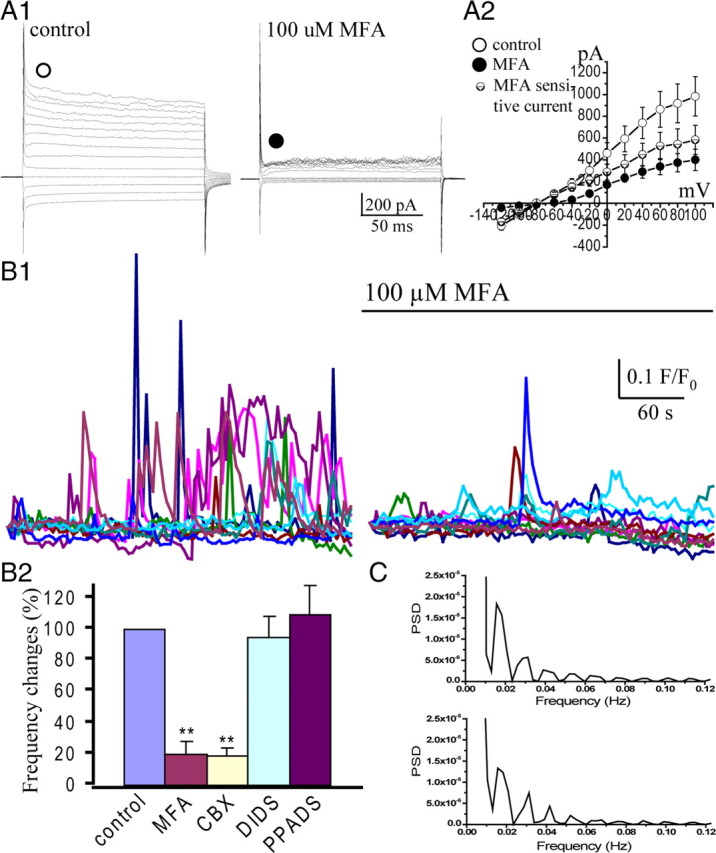
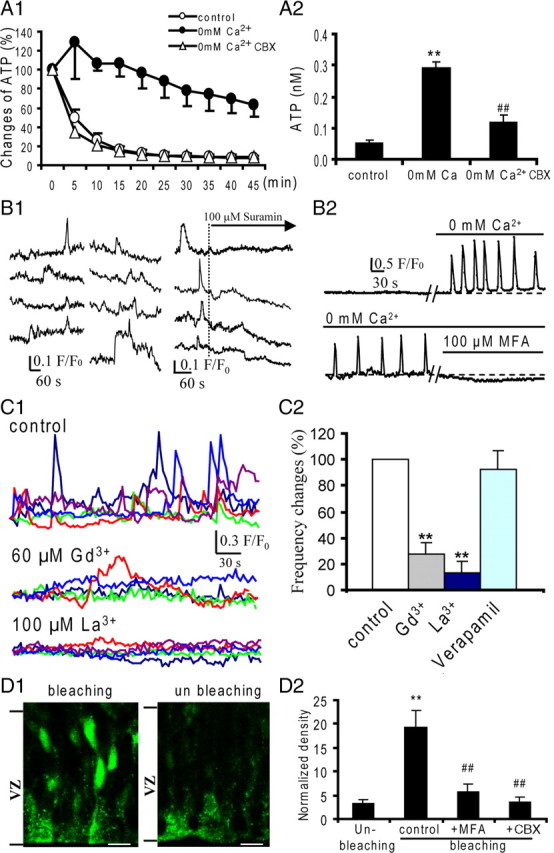
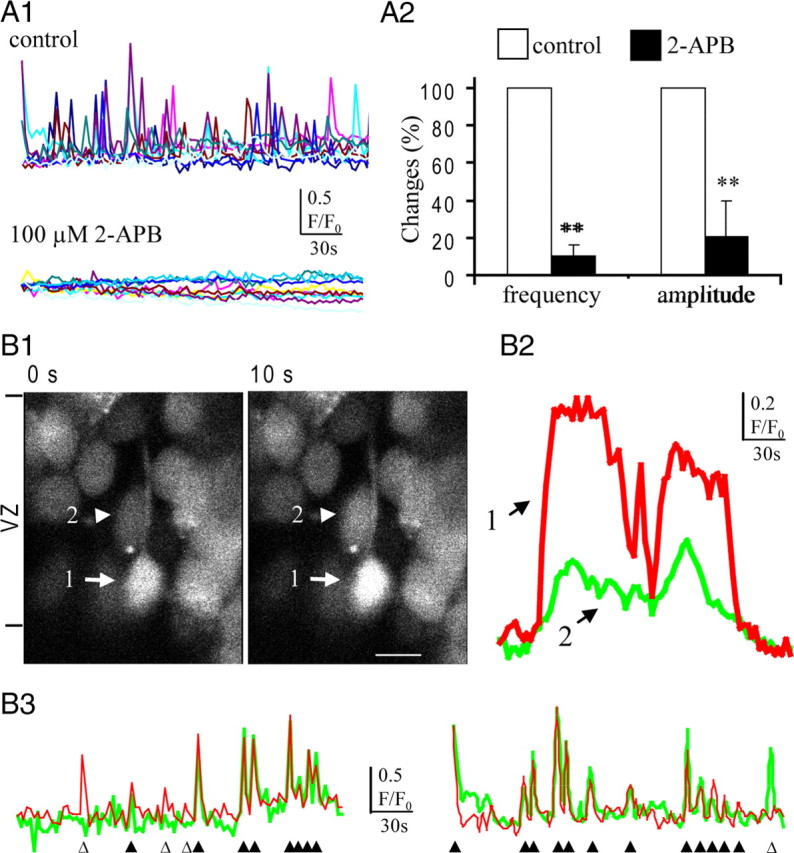
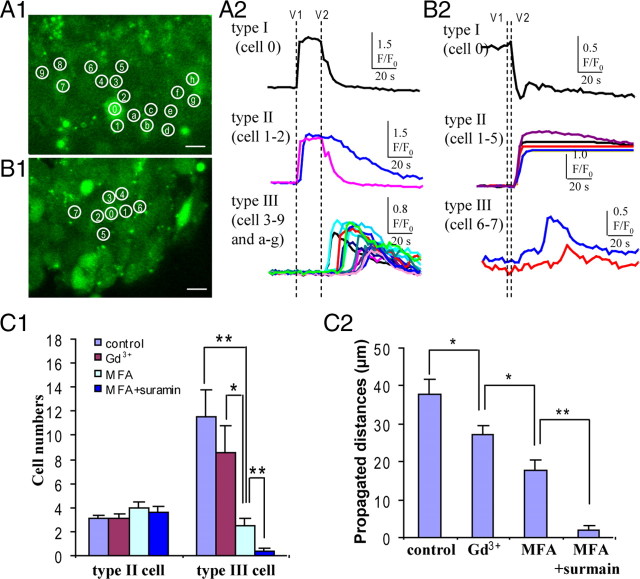
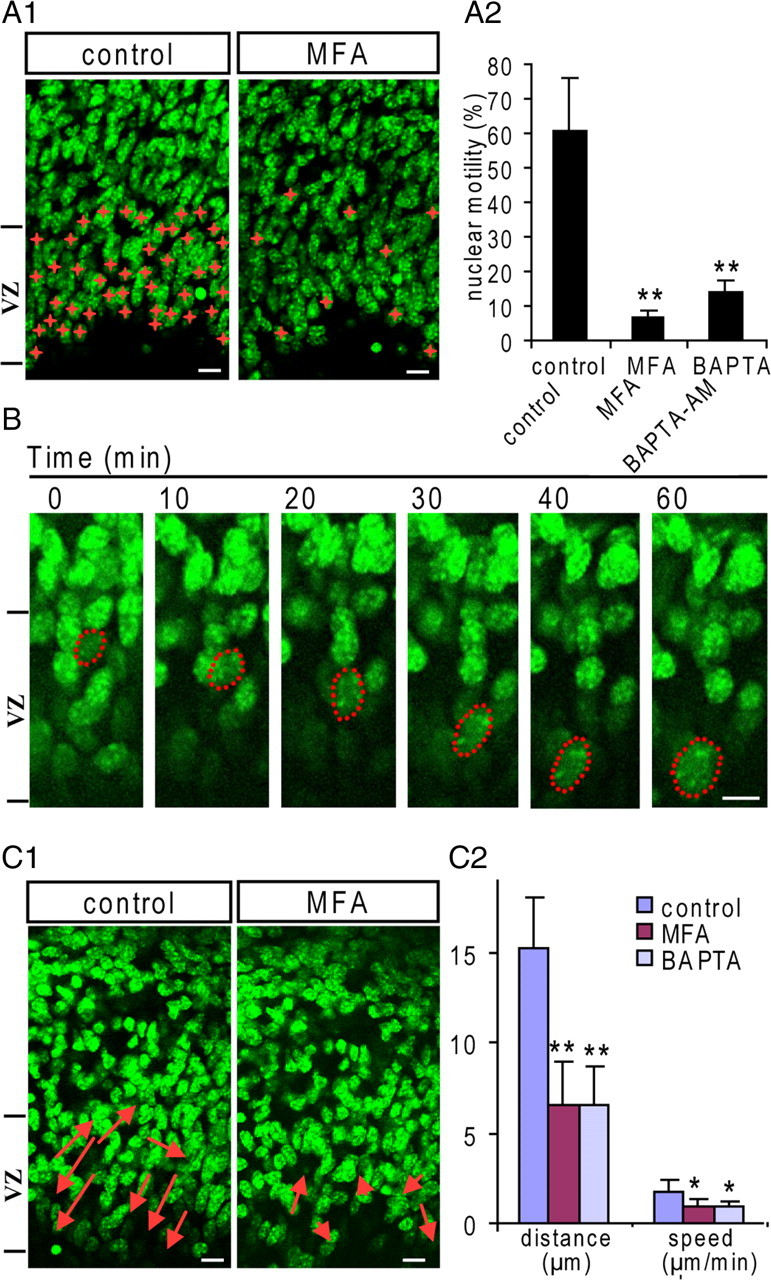
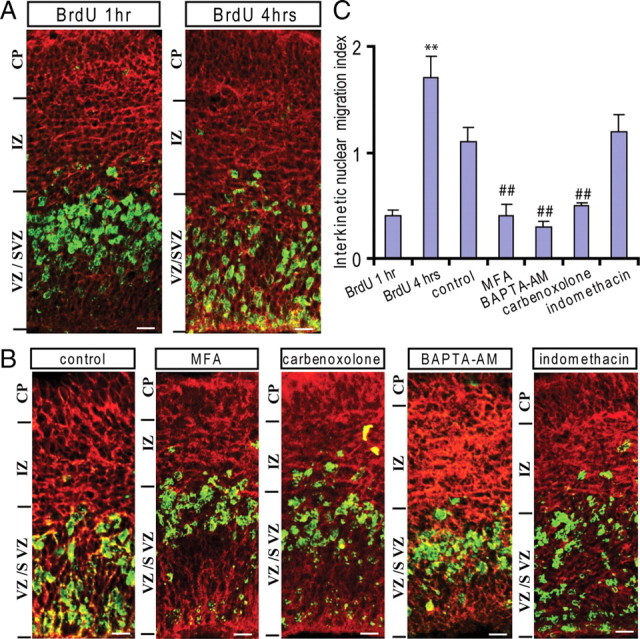
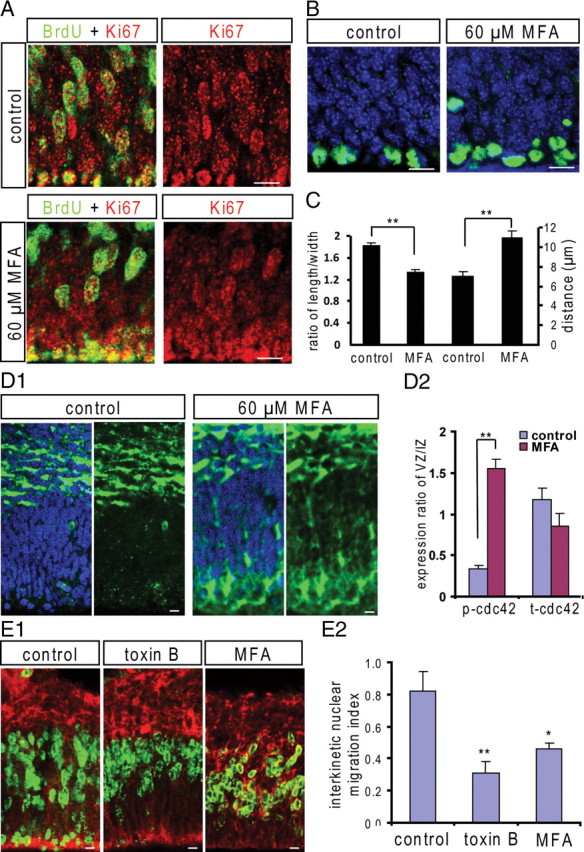
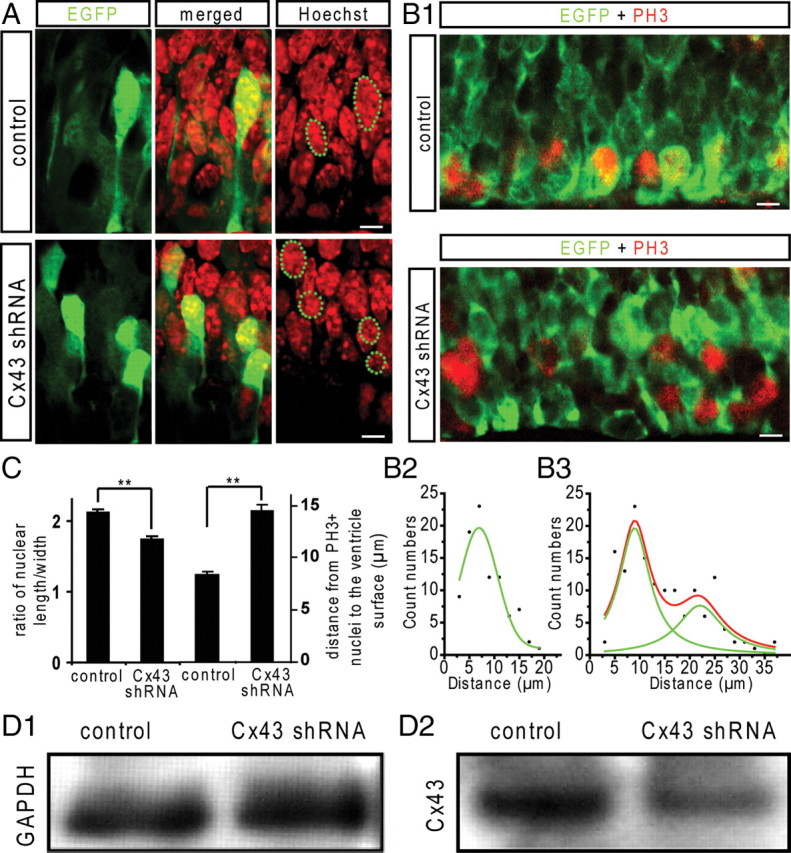
During mitotic division in the telencephalic proliferative ventricular zone (VZ), the nuclei of the neural precursors move basally away from the ventricular surface for DNA synthesis, and apically return to the surface for mitotic division; a process known as interkinetic migration or "to-and-fro" nuclear translocation. The cell, which remains attached to the ventricular surface, either continues cycling, or exits the cycle and migrates to the subventricular zone or the developing cortical plate. Although gap junctions/hemichannels are known to modulate DNA synthesis via Ca(2+) waves, the role of Ca(+) oscillations and the mechanism of nuclear translocation in the VZ precursors are unclear. Here, we provide evidence that, during apical nuclear migration, VZ precursors display dynamic spontaneous Ca(2+) transients, which depend on functional gap junctions/hemichannels via ATP release and Ca(2+)-mobilizing messenger diffusion. Furthermore, we found that blocking gap junctions/hemichannels or short hairpin RNA-mediated knockdown of Cx43 (connexin 43) retards the apically directed interkinetic nuclear migration accompanied with changes in the nuclear length/width ratio. In addition, we demonstrated that blocking functional gap junctions/hemichannels induces phosphorylation of small GTPase cdc42 in the VZ precursors. The basal phase of interkinetic migration is much slower and appears to be mediated passively by mechanical forces after cell division. Our findings indicate that functional interference with gap junctions/hemichannels during embryonic development may lead to abnormal corticogenesis and dysfunction of the cerebral cortex in adult organisms.


Figures

Figure 1.
Figure 1.
Neural precursors in the VZ/SVZ display dynamic spontaneous oscillatory Ca2+ transients. A1, Spontaneous Ca2+ transients were detected in VZ/SVZ cells in an acute cortical slice from the mouse embryonic brain (E15). The representative cells that display spontaneous Ca2+ transients are marked by either circles or squares numbered from 0 to 9. Scale bar, 20 μm. The dotted line indicates the ventricular surface. A2, The traces show the spontaneous Ca2+ transients in cells indicated by either circles or squares in A1. Two types of distinct Ca2+ oscillations can be classified in the VZ/SVZ cells. The first type shows high frequency with shorter duration (circles numbered from 0 to 9), and the second type shows lower frequency with relative longer duration (squares numbered from 0 to 9). Both types of Ca2+ oscillations were observed in the cells across the whole range of the VZ/SVZ. B, Power spectral analysis of Ca2+ signaling. The power spectra of high-frequency Ca2+ transients (B1) and low-frequency Ca2+ transients (B2) from the traces in A2 (top panel). B3, The percentages of power spectral density at lower (0.005–0.02 Hz) and higher (0.02–1.2 Hz) frequency bands in both the high- and low-frequency Ca2+ transients. **p < 0.01; n = 10, respectively. Error bars indicate SEM.
Figure 2.
Figure 2.
Spontaneous Ca2+ transients depend on functional gap junctions/hemichannels in the VZ/SVZ. A, Whole-cell patch-clamp recording in the VZ cells. A1, Passive currents were observed in a VZ cell, when step voltages (from −120 to 100 mV) were applied. The passive currents were reduced by application of gap junction blocker MFA (100 μm). A2, I–V curves show the passive currents in control (○), during MFA application (●), and the MFA-sensitive currents (⊝). The MFA-sensitive current reverses at −78 mV. B1, Traces show representative Ca2+ transients in the VZ cells before and after MFA application. B2, Percentage changes of mean frequency of the spontaneous Ca2+ transients in the VZ cells before and during MFA (100 μm), CBX (100 μm), DIDS (10 μm), or PPADS (10 μm) application (**p < 0.01; n = 4, 4, 4, 5, respectively). Error bars indicate SEM. C, Power spectra of spontaneous Ca2+ transients in two representative cells in B1 after blocking gap junctions/hemichannels with MFA. Note the regular harmonic peaks.
Figure 3.
Figure 3.
ATP is released via functional gap junctions/hemichannels in the VZ precursors. A1, ATP release curves in the slices perfused with the control (ACSF) (○), 0 mm Ca2+ (●), and 0 mm Ca2+ plus CBX (100 μm) (▵) perfusate. In the control perfusate, ATP release was decreased with first-order exponential decay (t 1/2 = 6.3 min). The 0 mm Ca2+ perfusion induced significant increase in ATP release and prolonged the t 1/2 to 36.3 min. Gap junction blocker CBX totally abolished 0 mm Ca2+-induced ATP release. A2, The remaining concentration of ATP in the control, 0 mm Ca2+, and 0 mm Ca2+ plus CBX perfusate after 45 min perfusion. **p < 0.01, n = 6, vs control. ## p < 0.01, n = 6, vs 0 mm Ca2+. B, GL261 cells loaded with Ca2+ indicator Fluor-4 were gently overlaid onto the surface of the embryonic cortical slices. B1, Small spontaneous Ca2+ transients were detected in GL261 cells at the region corresponding to the VZ/SVZ. Suramin application abolished the spontaneous Ca2+ transients in GL261 cells. B2, In a silent GL261 cell overlaid onto the region of the VZ/SVZ, 0 mm Ca2+ ACSF perfusion induced spontaneous Ca2+ transients. Gap junctions/hemichannels blocker MFA (100 μm) abolished 0 mm Ca2+ ACSF-induced Ca2+ transients. C1, Profiles of spontaneous Ca2+ transients in the VZ precursors before and during hemichannel blocker Gd3+ or La3+ application. C2, Percentage changes of the mean frequency of the spontaneous Ca2+ transients in the VZ cells before and during Gd3+ (60 μm), La3+ (100 μm), or verapamil (10 μm) application (**p < 0.01; n = 8, 6, 8, 4, respectively). D, Embryonic brain slices were loaded with Ca2+ caged agent (NP-EGTA; 5 μm) and elevated intracellular Ca2+ induces Lucifer yellow uptake in the VZ cells. D1, In the UV bleached hemisphere, Lucifer yellow-positive cells were detected and mainly locate at the upper portion of the VZ. In the unbleached hemisphere, no apparent Lucifer yellow-positive cells were detected. Scale bars, 10 μm. D2, Normalized fluorescence intensity of Lucifer yellow uptake cells in slices treated with unbleaching, bleaching, bleaching plus MFA (100 μm), and bleaching plus CBX (100 μm). **p < 0.01 vs unbleaching, n = 11. ## p < 0.01 vs bleaching, n = 13 and 9, respectively. Error bars indicate SEM.
Figure 4.
Figure 4.
Ca2+ signal transfer among the VZ precursors. A1, Profile of spontaneous Ca2+ transients in the VZ/SVZ cells before and during the IP3 receptor blocker 2-APB application. A2, Changes of mean frequency and amplitude of spontaneous Ca2+ transients in VZ cells after blocking the IP3 receptor (**p < 0.01; n = 4). Error bars indicate SEM. B, Synchronized Ca2+ transients in adjacent VZ cells. B1, After the large Ca2+ transients in a presumably radial glia (cell 1, arrow), small Ca2+ increase was observed simultaneously in an adjacent cell (cell 2, arrowhead) in the VZ. The ventricular surface is at the bottom of the images. Scale bar, 10 μm. B2, Traces show the Ca2+ transients in the cells indicated by the corresponding numbers in B1. B3, Another two typical pair of synchronized Ca2+ transients in adjacent VZ precursors. The open and solid triangles indicate the nonsynchronized and synchronized Ca2+ transients, respectively.
Figure 5.
Figure 5.
Ca2+ signaling propagation among the VZ precursors. A1, Two-photon single-cell stimulation induced Ca2+ signaling propagation in the VZ. The stimulated cell (type I cell) is marked as number 0. The first-order cells (type II cells) are marked as numbers 1 and 2. The propagated cells are marked as numbers 3–9 and a to g. Scale bar, 10 μm. A2, The Ca2+ responses and their propagation from the stimulated cells to the first-order cells and the propagated cells. B1, Two-photon single-cell stimulation induced Ca2+ signaling propagation in the VZ in the presence of MFA. The stimulated cell (type I cell) is marked as number 0. The first-order cells (type II cells) are marked as numbers 1–5. The propagated cells are marked as numbers 6 and 7. B2, The Ca2+ signaling responses and their propagation from the stimulated cells to the first-order cells and the propagated cells in the presence of MFA. C1, The changes of the mean number of the first-order cells and the propagated cells in control and in the presence of Gd3+, MFA, and MFA plus suramin. *p < 0.05, **p < 0.01; n = 19, 13, 8, and 9, respectively. C2, The changes of the maximum propagated distance in control and in the presence of Gd3+, MFA, and MFA plus suramin. *p < 0.05, **p < 0.01; n = 19, 13, 8, and 9, respectively. Error bars indicate SEM.
Figure 6.
Figure 6.
Interkinetic nuclear migration requires functional gap junctions/hemichannels in the VZ. The nuclei of the VZ precursors were labeled with Hoechst 33258, and time-lapse imagings were performed in acute slices in ACSF. A1, During the 10 min recording period, VZ precursors displaying nuclear motility are marked with red crosses in control and MFA-treated slice. Scale bar, 10 μm. A2, The percentage of VZ precursors displaying nuclear motility in control, MFA (100 μm)-, and BAPTA-AM (50 μm; BAPTA)-treated slices (**p < 0.01; n = 6, 6, and 4, respectively). B, Illustration of an apically directed interkinetic nuclear migration from the upper portion of the VZ to the ventricular surface in control ACSF. Note the nuclear shape becomes more elongated during migration. Scale bar, 5 μm. C1, During the 60 min recording period, the cells displaying interkinetic nuclear migration in the VZ are indicated by arrows in the control, MFA (100 μm)-treated slices. The length of the arrow indicates the migration distance and the direction of the arrowhead indicates the migration direction. Scale bar, 10 μm. C2, The mean values of interkinetic nuclear migration speed and distance of the VZ precursors in control, MFA-, and BAPTA-AM-treated slices (**p < 0.01, *p < 0.05, n = 4, 5, 3, respectively). Error bars indicate SEM.
Figure 7.
Figure 7.
Blocking gap junctions/hemichannels inhibits the apically directed interkinetic nuclear migration in the VZ. A, The S-phase cells were labeled by BrdU injection (50 mg/kg, i.p.) in pregnant mice (E15.5), and the position of the BrdU+ nucleus was examined by immunostaining 1 and 4 h later. A, The BrdU-labeled nuclei (green) are mainly located at the upper portion of the VZ/SVZ 1 h after BrdU injection. Many BrdU-labeled nuclei apically migrated to the lower portion of the VZ/SVZ 4 h after BrdU injection in vivo. The outlines of the slices were illustrated by Tuj-1 staining (red). Scale bar, 10 μm. B, BrdU-labeled brain slices (1 h) were used for organotypic slice culture. Immunostaining for BrdU (green) in control, MFA (60 μm)-, CBX (60 μm)-, BAPTA-AM (50 μm)-, or indomethacin (100 μm)-incubated slices for 3 h. Scale bar, 10 μm. C, The ratios of the BrdU immunostaining intensity of the lower half of the VZ/SVZ to the upper half after BrdU injection (1 h), in vivo for 3 h (**p < 0.01; n = 6, respectively) and in culture for 3 h in control, MFA, BAPTA-AM, CBX, and indomethacin ## p < 0.01; n = 7, except n = 6 for MFA). Error bars indicate SEM.
Figure 8.
Figure 8.
Blocking gap junctions/hemichannels changes the length/width ratio of nucleus and induces cdc42 phosphorylation. A, Coimmunostaining for Ki67 and BrdU in control and MFA-treated (60 μm; 60 min) slices that had been labeled with BrdU 3 h after BrdU intraperitoneal injection at E15. The G2-phase cells in the VZ are identified by the Ki67+/BrdU+ nuclei. Scale bar, 10 μm. B, pH3 staining in control and in MFA-treated slices (60 μm; 3 h). pH3+ cells mainly located at ventricular surface within the VZ in the control slices. Some pH3+ cells appeared in the VZ above the ventricular surface in MFA-treated slices. Scale bar, 10 μm. C, The length/width ratios of nuclei of G2-phase cells in control and MFA-treated slices. **p < 0.01; n = 48, 56, respectively; and the mean distances of pH3+ nuclei to the ventricle surface in control and in MFA-treated slices. **p < 0.01; n = 28, 52, respectively. D1, p-cdc42 immunostaining in control and MFA-treated slices. p-cdc42 is mainly expressed in the IZ cells in the control slices. MFA treatment (60 μm; 60 min) induced p-cdc42 increase in the VZ precursors. Scale bar, 10 μm. D2, The ratios of p-cdc42 signaling and t-cdc42 signaling in the VZ to the IZ in control and MFA-treated slices. **p < 0.01, n = 8 for p-cdc2 and n = 10 for t-cdc42. E, BrdU-labeled brain slices (1 h; E14) were used for slice culture. E1, Immunostaining for BrdU (green) in control, toxin B (1 ng/ml)-, and MFA (60 μm)-incubated slices for 3 h. Scale bar, 10 μm. E2, The ratios of the BrdU immunostaining density of the lower half to the upper half of the VZ/SVZ after culture for 3 h (*p < 0.05, **p < 0.01; n = 7, 6, 6, respectively). Error bars indicate SEM.
Figure 9.
Figure 9.
Knockdown of Cx43 affects the apically directed interkinetic nuclear migration in the VZ precursors. EGFP plasmid with Cx43 or scrambled control shRNA plasmids were electroporated into the VZ precursors at E15, and the nuclei of the EGFP+ VZ precursors were examined at E16.5. A, In the control brain, the EGFP+ VZ precursors identified by the foot-like process attached to the ventricular surface display olive-like cell body and radially elongated nuclei. In Cx43 shRNA electroporated brain, the EGFP+ VZ precursors display thermo balloon-like cell body and less elongated nuclei that locate at the top of the cell body. Scale bar, 5 μm. B1, The M-phase cells in the VZ were detected by pH3 immunostaining (red). In the control brain, almost all of the pH3+ cells in the VZ locate at the ventricular surface. In the Cx43 shRNA electroporated brain, some pH3+ cells are in the VZ above the ventricular surface. Scale bar, 5 μm. Count distributions of pH3+ nuclei according to their distances to the ventricular surface in control (B2) and in Cx43 shRNA electroporated brain (B3). C, The nuclear length/width ratio in the VZ precursors in control and Cx43 shRNA electroporated brains (**p < 0.01; n = 22, 37, respectively) and the mean value of the distances of pH3+ nuclei to the ventricle surface in control and in Cx43 shRNA electroporated brain (**p < 0.01; n = 90, 146, respectively). Error bars indicate SEM. D1, D2, Immunoblots for GAPDH and Cx43 in N2a cells transfected with Cx43 full-length DNA, pCAG-EGFP and scramble or Cx43 shRNA.

Similar articles

Cited by

References

    1. Alexandre H, Van Cauwenberge A, Mulnard J. Involvement of microtubules and microfilaments in the control of the nuclear movement during maturation of mouse oocyte. Dev Biol. 1989;136:311–320. - PubMed
    1. Algan O, Rakic P. Radiation-induced, lamina-specific deletion of neurons in the primate visual cortex. J Comp Neurol. 1997;381:335–352. - PubMed
    1. Ang ES, Jr, Gluncic V, Duque A, Schafer ME, Rakic P. Prenatal exposure to ultrasound waves impacts neuronal migration in mice. Proc Natl Acad Sci U S A. 2006;103:12903–12910. - PMC - PubMed
    1. Anselmi F, Hernandez VH, Crispino G, Seydel A, Ortolano S, Roper SD, Kessaris N, Richardson W, Rickheit G, Filippov MA, Monyer H, Mammano F. ATP release through connexin hemichannels and gap junction transfer of second messengers propagate Ca2+ signals across the inner ear. Proc Natl Acad Sci U S A. 2008;105:18770–18775. - PMC - PubMed
    1. Azzam EI, de Toledo SM, Little JB. Expression of CONNEXIN43 is highly sensitive to ionizing radiation and other environmental stresses. Cancer Res. 2003;63:7128–7135. - PubMed

Publication types

MeSH terms