. 2010 Mar 24;30(12):4285-94.
doi: 10.1523/JNEUROSCI.6063-09.2010.

Negative blood oxygen level dependence in the rat: a model for investigating the role of suppression in neurovascular coupling

Affiliations

Negative blood oxygen level dependence in the rat: a model for investigating the role of suppression in neurovascular coupling

Luke Boorman et al. J Neurosci. .

Abstract

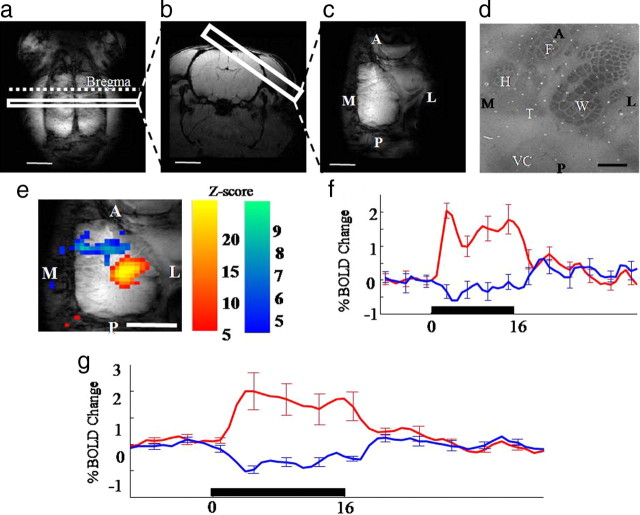
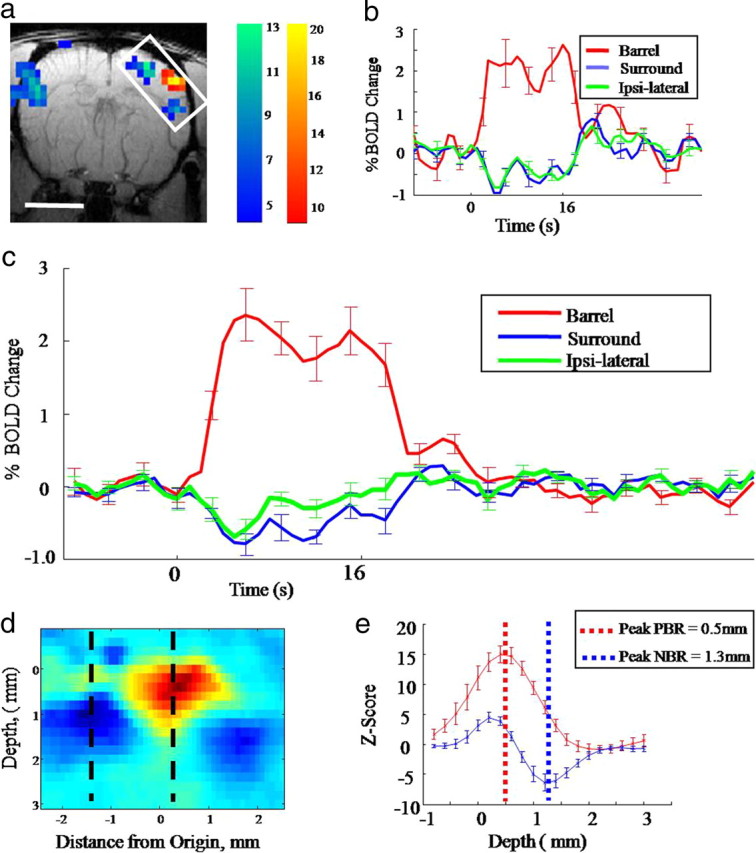
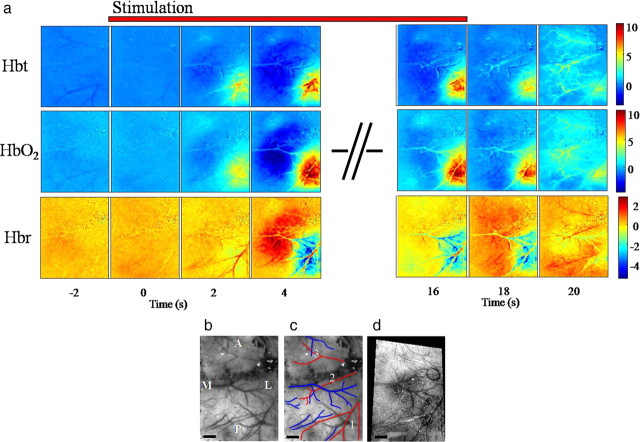
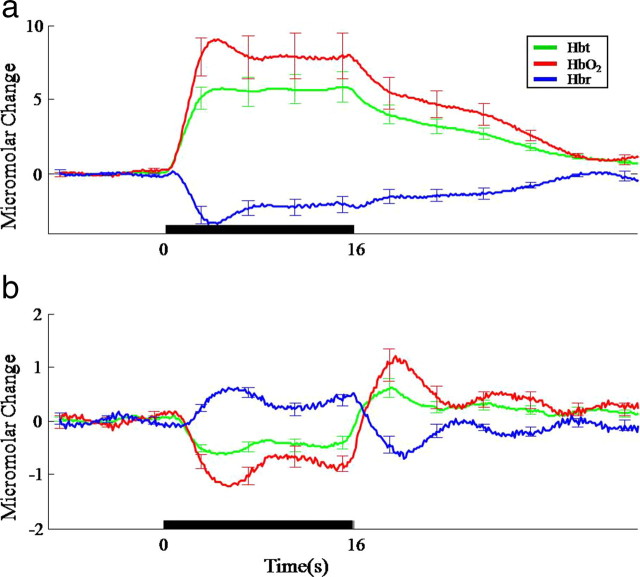
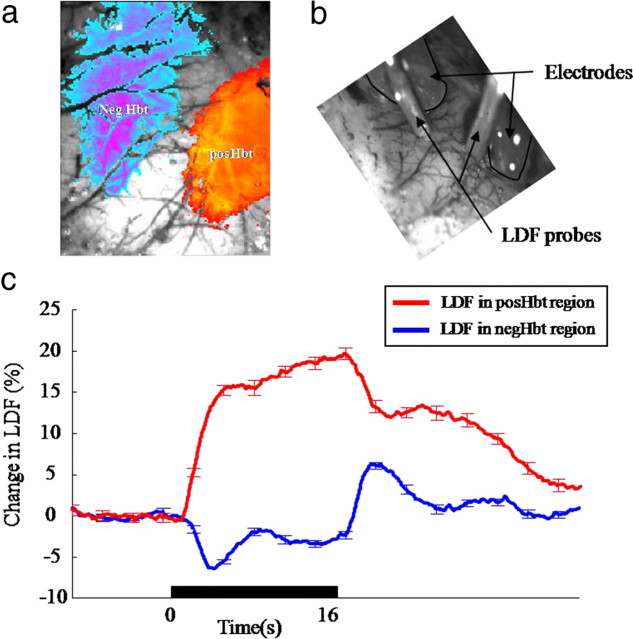
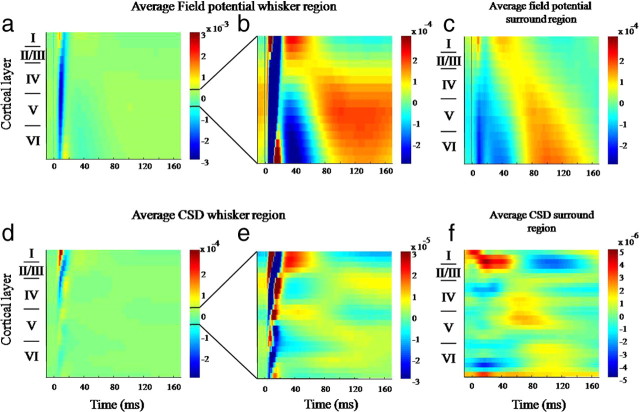
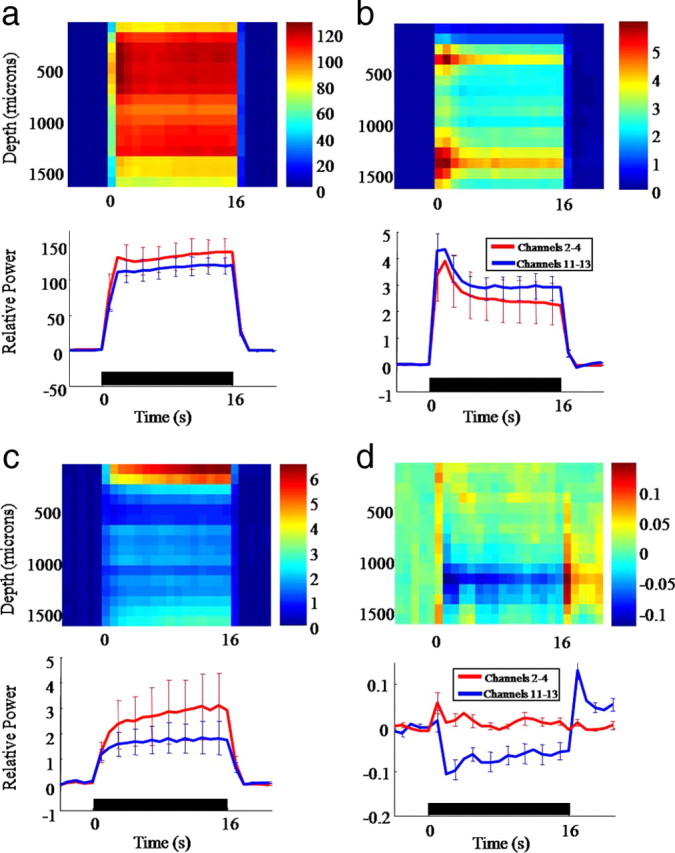
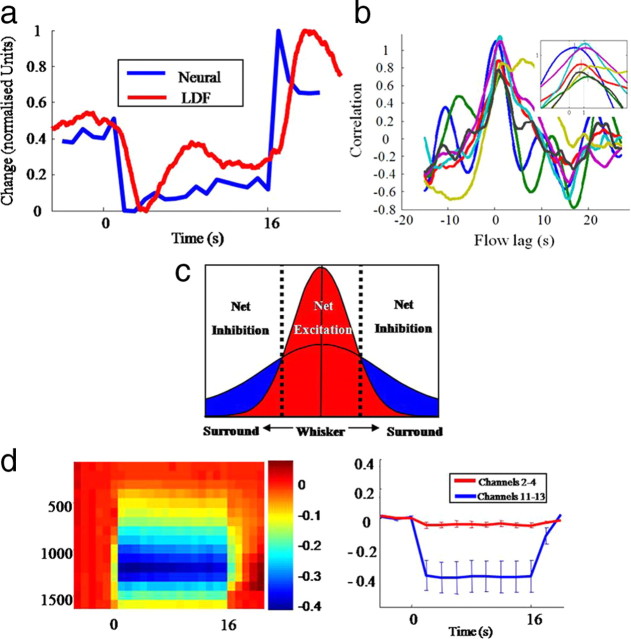
Modern neuroimaging techniques rely on neurovascular coupling to show regions of increased brain activation. However, little is known of the neurovascular coupling relationships that exist for inhibitory signals. To address this issue directly we developed a preparation to investigate the signal sources of one of these proposed inhibitory neurovascular signals, the negative blood oxygen level-dependent (BOLD) response (NBR), in rat somatosensory cortex. We found a reliable NBR measured in rat somatosensory cortex in response to unilateral electrical whisker stimulation, which was located in deeper cortical layers relative to the positive BOLD response. Separate optical measurements (two-dimensional optical imaging spectroscopy and laser Doppler flowmetry) revealed that the NBR was a result of decreased blood volume and flow and increased levels of deoxyhemoglobin. Neural activity in the NBR region, measured by multichannel electrodes, varied considerably as a function of cortical depth. There was a decrease in neuronal activity in deep cortical laminae. After cessation of whisker stimulation there was a large increase in neural activity above baseline. Both the decrease in neuronal activity and increase above baseline after stimulation cessation correlated well with the simultaneous measurement of blood flow suggesting that the NBR is related to decreases in neural activity in deep cortical layers. Interestingly, the magnitude of the neural decrease was largest in regions showing stimulus-evoked positive BOLD responses. Since a similar type of neural suppression in surround regions was associated with a negative BOLD signal, the increased levels of suppression in positive BOLD regions could importantly moderate the size of the observed BOLD response.


Figures

Figure 1.
Figure 1.
a–d, Structural MRI images to define image orientations of transverse (a), coronal (b), or tengential image planes (c) (scale bar, 5 mm), and cytochrome oxidase-stained layer IV (d) rat somatosensory cortex. Orientation: A, Anterior; L, lateral; M, medial; P, posterior. Anatomical regions: W, Whisker; F, forepaw; H, hindpaw; T, trunk; VC, visual cortex. Scale bar, 1 mm. e, Activation map for a representative animal showing PBR and NBR in response to a 16 s whisker stimulation in the tangential image plane. f, Trial-averaged time series responses taken from the PBR and NBR regions. g, Average PBR and NBR across 6 animals (error bars, SEM; scale bar, 5 mm).
Figure 2.
Figure 2.
Representative fMRI BOLD results in the coronal image plane. a, Activation map for a representative animal showing PBR and NBR in response to a 16 s whisker stimulation (scale bar, 5 mm). b, Trial-averaged time series responses taken from the PBR and NBR regions. c, Average PBR and NBR across 6 animals. d, Enlarged and rotated BOLD activation map taken from the inset box in a; this shows that the NBR appears to originate from a deeper cortical location than the PBR. e, Z-scores as a function of depth for both the NBR and PBR across all animals. The PBR peaks at a depth of 0.5 mm, the NBR peaks at a depth of 1.3 mm in the deeper cortical layers.
Figure 3.
Figure 3.
The hemodynamic response for (16 s) electrical whisker stimulation (1.2 mA at 5 Hz). a, Image montage for Hbt, HbO2, and Hbr. Each image represents a snapshot in time before, during, and after the 16 s stimulus. The scale bar represents the micromolar change from baseline. Stimulation occurs at time 0. b, c, In vivo images of the surface vasculature show the branches of the middle cerebral artery (red) and draining veins (blue). Branch 1 of the artery supplies the whisker barrel cortex, branch 2 the forepaw region, and branch 3 the motor cortex in front of bregma. d, The relationship of the barrel cortex to the surface vasculature is shown in a combined postmortem image. This postmortem image was fitted to the in vivo image so that the barrels could then be superimposed over the activation maps as a reference. M, Medial; L, lateral; A, anterior; P, posterior. Scale bar, 1000 μm.
Figure 4.
Figure 4.
Average time series responses for Hbt, HbO2, and Hbr following 16 s electrical whisker stimulation taken from selected regions across animals. a, Parenchyma region in whisker barrel cortex. b, Parenchyma from surround negHbt region (error bars, SEM).
Figure 5.
Figure 5.
Placement of and response from laser Doppler flowmetry probes to 16 s whisker stimulation. a, Activation map showing regions of increased and decreased blood volume which provided targets for the placement of 16-channel electrode and LDF probe. b, Image showing electrodes inserted in, and LDF probes over the regions of increased and decreased Hbt. c, Cerebral blood flow responses from the LDF probe placed over the posHbt and negHbt regions (error bars, SEM).
Figure 6.
Figure 6.
Field potential and current source density (CSD) responses to 16 s whisker stimulation in whisker barrel cortex and surrounding region. All responses represent an average of the 80 (16 × 5 Hz) whisker deflections across the animals and trials. a, Average field potential responses from the electrode inserted into the whisker region. b, Same response shown in a with the threshold decreased to enable visualization of long latency responses occurring after 30 ms. c, Field potential responses in surround region. d, CSD responses from whisker barrel region. e, Same response as shown in d, with the threshold decreased to reveal long latency CSD responses. f, CSD responses from the surround region.
Figure 7.
Figure 7.
Frequency power analysis of 16-channel electrode recordings in the whisker and surround regions. a, Top image: 30–130 Hz power response in 1 s bins for the whisker region. Bottom Image: Average time series taken through shallow (2–4) and deep (11–13) electrode channels. b, Top image: 500–3000 Hz power response in 1 s bins for the whisker region. Bottom image: Average time series taken through shallow (2–4) and deep (11–13) electrode channels. c, Top image: 30–130 Hz power response in 1 s bins for the surround region. Bottom image: Average time series taken through shallow (2–4) and deep (11–13) electrode channels. d, Top image: 500–3000 Hz power response in 1 s bins for the surround. Bottom image: Average time series taken through shallow (2–4) and deep (11–13) electrode channels.
Figure 8.
Figure 8.
Simultaneous neural activation and cerebral blood flow (CBF) in surround region. a, Normalized plot of CBF and 500–3000 Hz power time series from channels 11–13 from the surround region. b, Cross-correlation analysis of individual animals at the onset of flow and neural decrease. c, Schematic model to explain net excitation and inhibition effects in whisker and surround regions. d, Left image: 500–3000 Hz power analysis in the whisker region with the first 20 ms after each stimulus impulse removed. Right image: average time series taken through shallow (2:4) and deep (11–13) electrode channels.

References

    1. Alexander GE, DeLong MR, Strick PL. Parallel organization of functionally segregated circuits linking basal ganglia and cortex. Annu Rev Neurosci. 1986;9:357–381. - PubMed
    1. Alonso Bde C, Lowe AS, Dear JP, Lee KC, Williams SC, Finnerty GT. Sensory inputs from whisking movements modify cortical whisker maps visualized with functional magnetic resonance imaging. Cereb Cortex. 2008;18:1314–1325. - PMC - PubMed
    1. Barth DS, Kithas J, Di S. Anatomic organization of evoked potentials in rat parietotemporal cortex: somatosensory and auditory responses. J Neurophysiol. 1993;69:1837–1849. - PubMed
    1. Berwick J, Redgrave P, Jones M, Hewson-Stoate N, Martindale J, Johnston D, Mayhew JE. Integration of neural responses originating from different regions of the cortical somatosensory map. Brain Res. 2004;1030:284–293. - PubMed
    1. Berwick J, Johnston D, Jones M, Martindale J, Redgrave P, McLoughlin N, Schiessl I, Mayhew JE. Neurovascular coupling investigated with two-dimensional optical imaging spectroscopy in rat whisker barrel cortex. Eur J Neurosci. 2005;22:1655–1666. - PubMed

Publication types

MeSH terms

LinkOut - more resources