. 2010 Mar 24;30(12):4295-305.
doi: 10.1523/JNEUROSCI.6198-09.2010.

Stimulation of the frontal eye field reveals persistent effective connectivity after controlled behavior

Affiliations

Stimulation of the frontal eye field reveals persistent effective connectivity after controlled behavior

Rei Akaishi et al. J Neurosci. .

Abstract

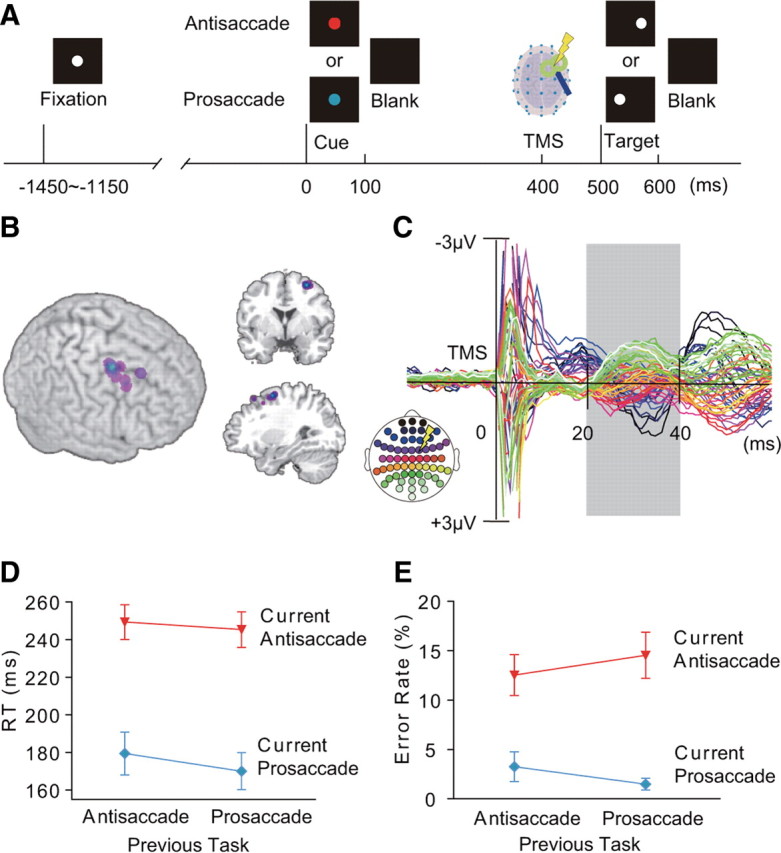
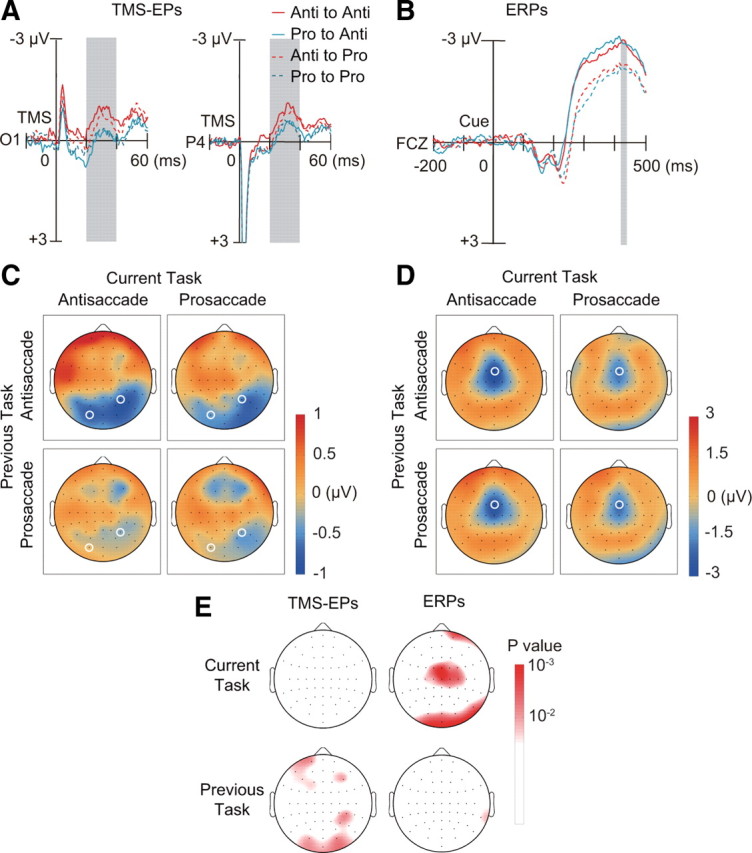
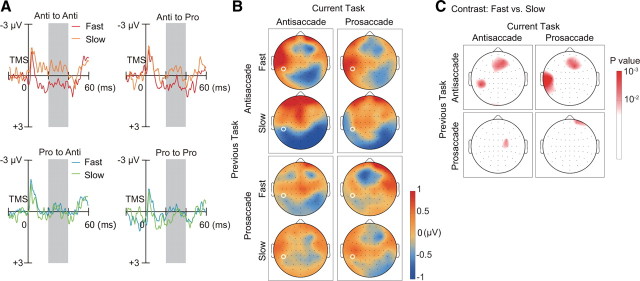
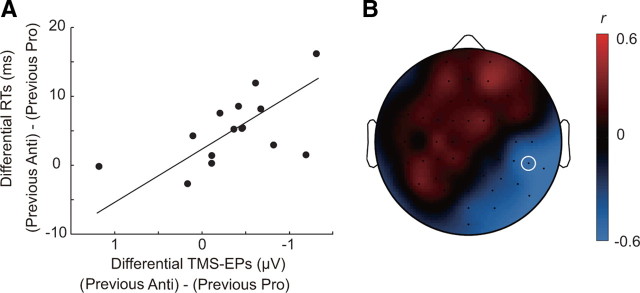
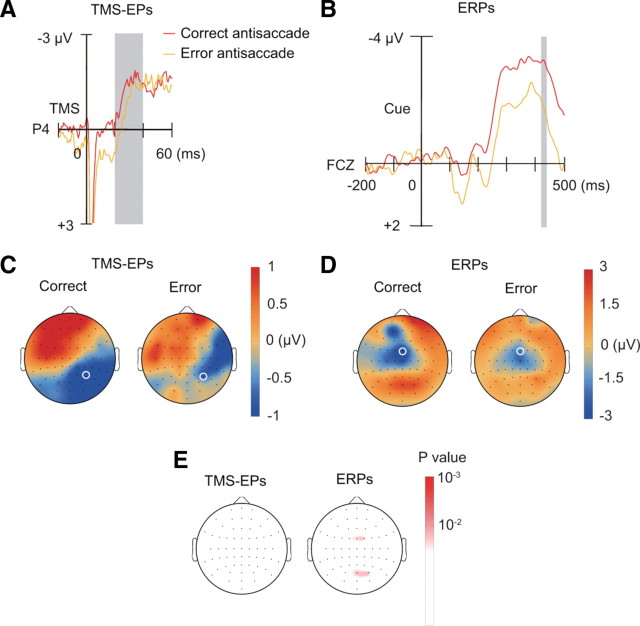
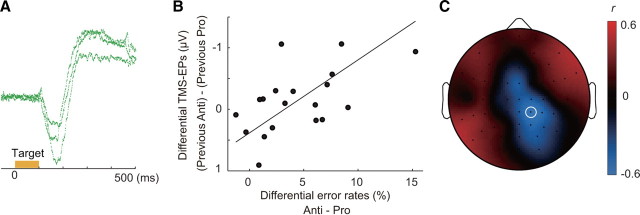
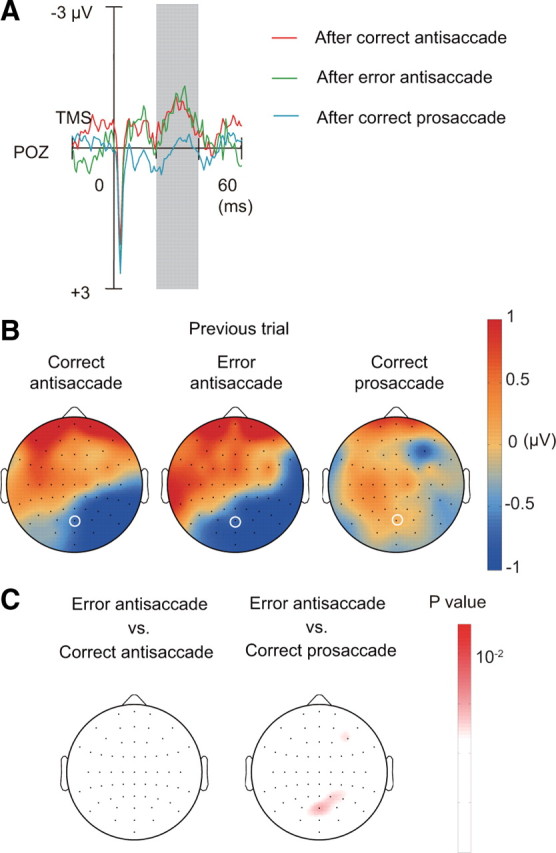
Our ability to choose nonhabitual controlled behavior instead of habitual automatic behavior is based on a flexible control mechanism subserved by neural activity representing the behavior-guiding rule. However, it has been shown that the behavior slows down more when switching from controlled to automatic behavior than vice versa. Here we show that persistent effective connectivity of the neural network after execution of controlled behavior is responsible for the behavioral slowing on a subsequent trial. We asked normal human subjects to perform a prosaccade or antisaccade task based on a cue and examined the effective connectivity of the neural network based on the pattern of neural impulse transmission induced by stimulation of the frontal eye field (FEF). Effective connectivity during the task preparation period was dependent on the task that subjects had performed on the previous trial, regardless of the upcoming task. The strength of this persistent effective connectivity was associated with saccade slowing especially on trials after controlled antisaccade. In contrast, the pattern of regional activation changed depending on the upcoming task regardless of the previous task and the decrease in activation was associated with errors in upcoming antisaccade task. These results suggest that the effective connectivity examined by FEF stimulation reflects a residual functional state of the network involved in performance of controlled antisaccade and its persistence may account for the behavioral slowing on the subsequent trial.


Figures

Figure 1.
Figure 1.
Cued saccade task and TMS-EPs. A, Time line of the task. Subjects made prosaccade or antisaccade according to a pretarget cue (red cue: antisaccade, cyan cue: prosaccade). B, Position of the FEF-TMS rendered on 3D surface of the MNI template brain (left), coronal section at y = 2 (upper right), and sagittal section at x = 30 (lower right). C, TMS-EPs averaged across all conditions and all subjects, displayed from −20 to 60 ms of TMS. TMS-EPs were calculated by subtracting the EEG waveforms on no-TMS trials from those on TMS trials. The analysis was focused on the time window of 20–40 ms after TMS (gray shading). Colors of the waveforms correspond to the electrode positions on the scalp (inset at lower left). A yellow symbol of lightening bolt in the inset indicates scalp position at which TMS was applied. D, E, Latency of saccade onset (RTs) (D) and error rates (E), separately shown for the four conditions based on the task on the previous and current trials. Mean and SE across subjects are shown.
Figure 2.
Figure 2.
Dissociation between TMS-EPs and ERPs. A, TMS-EPs at electrode O1 and P4 (marked with white circle in C), separately shown for the four conditions based on the previous tasks (red: antisaccade; cyan: prosaccade) and current tasks (continuous line: antisaccade; dotted line: prosaccade). B, ERPs on no-TMS trials at electrode FCZ (marked with white circle in D). Convention same as in A. C, Scalp topography of TMS-EPs amplitude within the time window of 20–40 ms after TMS (gray shading in A), separately shown for previous task (rows) and current task (columns). Amplitudes were linearly interpolated across electrode positions and color-coded according to the color bar on the right. D, Scalp topography of ERPs amplitude within the time window of 420–440 ms after the cue onset (gray shading in B), which corresponds to 20–40 ms after TMS on TMS trials. E, Scalp topography of p values based on two-way ANOVA with factors of current task (upper row) and previous task (lower row). Results are shown separately for TMS-EPs (left column) and ERPs (right column). The p values are linearly interpolated across electrode positions and color-coded according to the color bar shown on the right.
Figure 3.
Figure 3.
TMS-EPs are associated with saccade latency on trials after antisaccade. A, TMS-EPs on fast and slow response trials at electrode TP7 (marked with white circle in B), separately shown for the four conditions based on the previous and current tasks. B, Scalp topography of TMS-EPs amplitude within the time window of 20–40 ms after TMS (gray shading in A). In each cell defined by the previous task (rows) and current task (columns), maps are shown separately for fast (upper) and slow (lower) response trials. C, Scalp topography of p values based on paired t test. TMS-EPs at each electrode position were compared between fast and slow response trials. Results are shown separately for the types of previous task (rows) and types of current task (columns).
Figure 4.
Figure 4.
TMS-EPs are associated with across-subject variability in response slowing. A, The difference in RTs between trials after antisaccade and trials after prosaccade is plotted against the difference in TMS-EPs between trials after antisaccade and trials after prosaccade at electrode TP8 (marked with white circle in B) for 15 subjects. B, Scalp topography of correlation coefficient, r, between differential RTs and differential TMS-EPs across subjects. The correlation coefficient was calculated for each electrode position and linearly interpolated across electrode positions.
Figure 5.
Figure 5.
TMS-EPs and ERPs on correct and error antisaccade trials. A, TMS-EPs at electrode P4 (marked with white circle in C) on correct and error antisaccade trials. B, ERPs on no-TMS trials at electrode FCZ (marked with white circle in D) on correct and error antisaccade trials. C, Scalp topography of TMS-EPs amplitude within the time window of 20–40 ms after TMS, separately shown for correct and error antisaccade trials. D, Scalp topography of ERPs amplitude within the time window of 420–440 ms after the cue onset, separately shown for correct and error antisaccade trials. E, Scalp topography of p values based on comparison by one-way ANOVA between correct and error antisaccade trials. Results are shown separately for TMS-EPs (left) and ERPs (right).
Figure 6.
Figure 6.
TMS-EPs after correct antisaccade are correlated with error rates across subjects. A, Representative EOG traces for erroneous reflexive saccade immediately followed by corrective antisaccade. B, The difference in TMS-EPs at electrode CP2 (marked with white circle in C) between trials after antisaccade and trials after prosaccade is plotted against the difference in error rates between antisaccade and prosaccade trials for 19 subjects. C, Scalp topography of correlation coefficient, r, between differential TMS-EPs and error rates calculated for each electrode position across subjects.
Figure 7.
Figure 7.
TMS-EPs on trials after correct antisaccade, error antisaccade, and correct prosaccade. A, TMS-EPs at electrode POZ (marked with white circle in B) on trials after correct antisaccade, error antisaccade, and correct prosaccade. B, Scalp topography of TMS-EPs amplitude, separately shown for trials after correct antisaccade (left), error antisaccade (center), and correct prosaccade (right). C, Scalp topography of p values based on comparison by one-way ANOVA between trials after error antisaccade and correct antisaccade (left) and between trials after error antisaccade and correct prosaccade (right).

References

    1. Allport A, Styles EA, Hsieh SL. Shifting intentional set: exploring the dynamic control of tasks. In: Umilta C, Moscovitch M, editors. Attention and performance. Vol. XV. Cambridge, MA: MIT; 1994. pp. 421–452.
    1. Aston-Jones G, Cohen JD. An integrative theory of locus coeruleus-norepinephrine function: adaptive gain and optimal performance. Annu Rev Neurosci. 2005;28:403–450. - PubMed
    1. Barton JJ, Greenzang C, Hefter R, Edelman J, Manoach DS. Switching, plasticity, and prediction in a saccadic task-switch paradigm. Exp Brain Res. 2006;168:76–87. - PubMed
    1. Botvinick MM, Braver TS, Barch DM, Carter CS, Cohen JD. Conflict monitoring and cognitive control. Psychol Rev. 2001;108:624–652. - PubMed
    1. Brown MR, Vilis T, Everling S. Frontoparietal activation with preparation for antisaccades. J Neurophysiol. 2007;98:1751–1762. - PubMed

Publication types

MeSH terms