

Essential role of dopamine D2 receptor in the maintenance of wakefulness, but not in homeostatic regulation of sleep, in mice
- PMID: 20335474
- PMCID: PMC6634511
- DOI: 10.1523/JNEUROSCI.4936-09.2010
Essential role of dopamine D2 receptor in the maintenance of wakefulness, but not in homeostatic regulation of sleep, in mice
Abstract
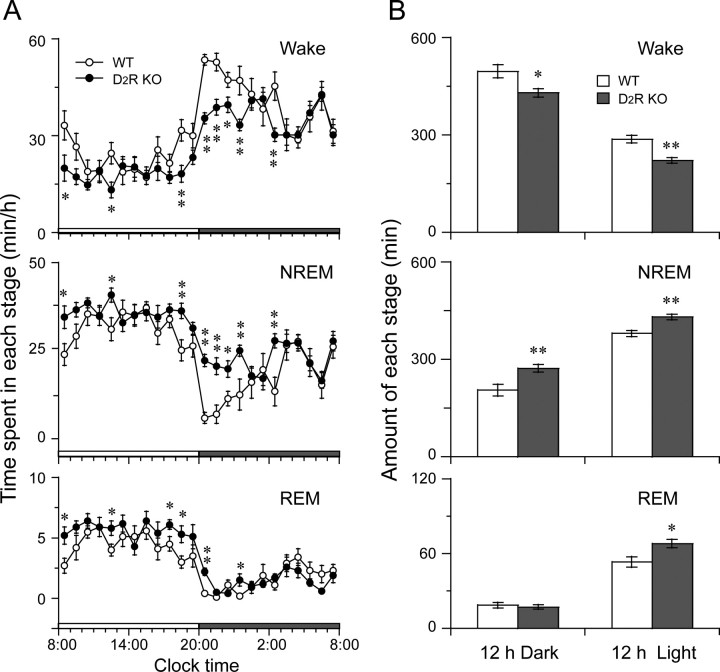
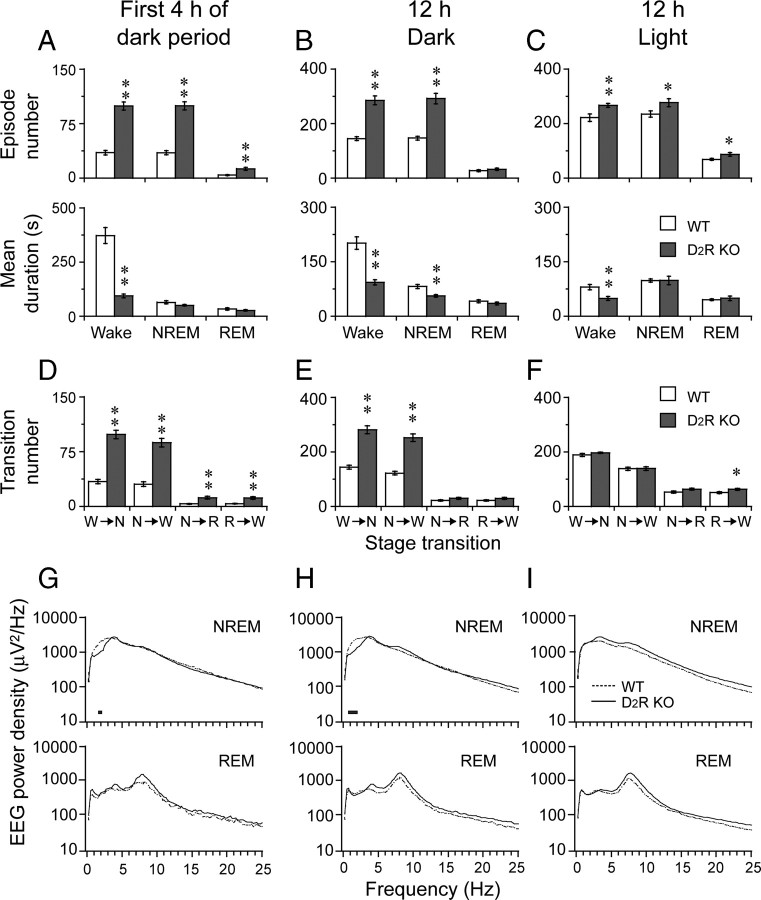
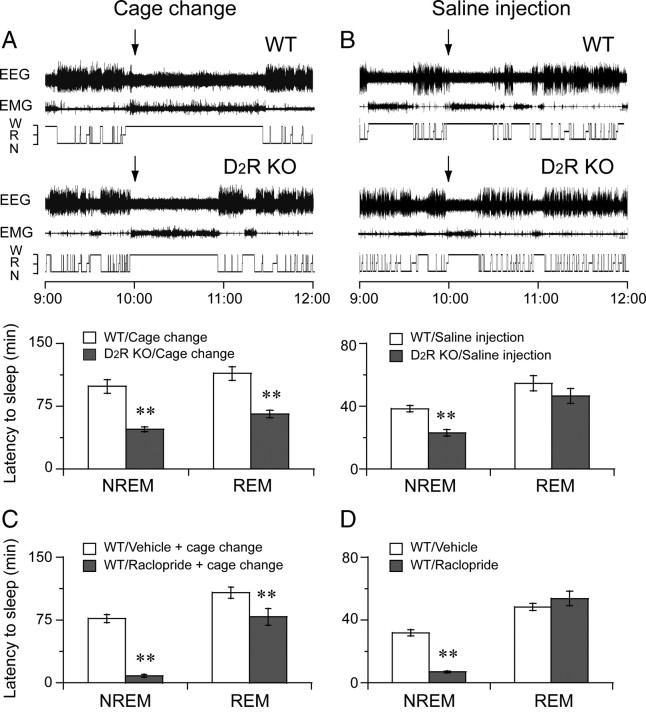
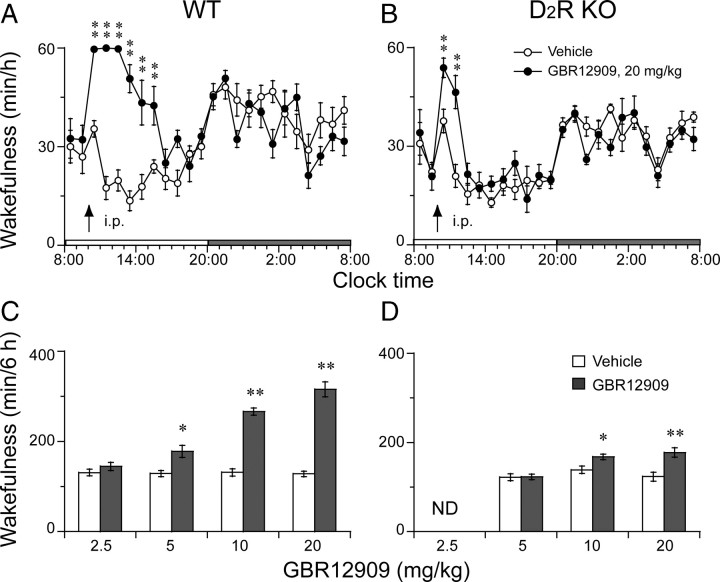
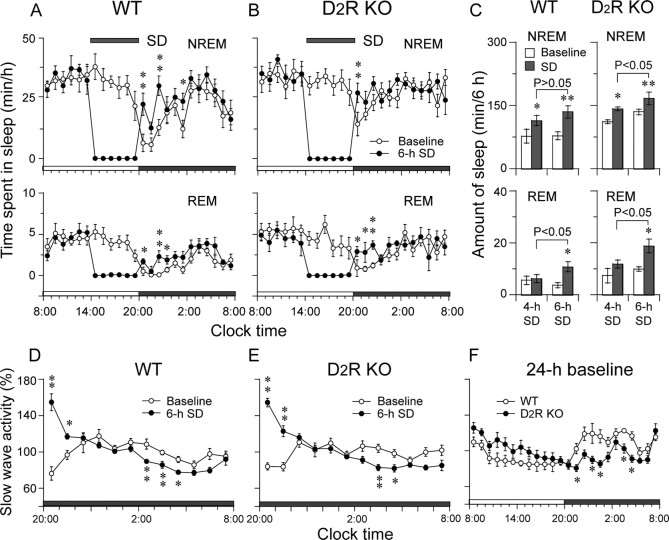
Dopamine (DA) and its D(2) receptor (R) are involved in cognition, reward processing, and drug addiction. However, their roles in sleep-wake regulation remain unclear. Herein we investigated the role of D(2)R in sleep-wake regulation by using D(2)R knock-out (KO) mice and pharmacological manipulation. Compared with WT mice, D(2)R KO mice exhibited a significant decrease in wakefulness, with a concomitant increase in non-rapid eye movement (non-REM, NREM) and REM sleep and a drastic decrease in the low-frequency (0.75-2 Hz) electroencephalogram delta power of NREM sleep, especially during the first 4 h after lights off. The KO mice had decreased mean episode duration and increased episode numbers of wake and NREM sleep, many stage transitions between wakefulness and NREM sleep during the dark period, suggesting the instability of the wake stage in these D(2)R KO mice. When the KO mice were subjected to a cage change or an intraperitoneal saline injection, the latency to sleep in the KO mice decreased to half of the level for WT mice. The D(2)R antagonist raclopride mimicked these effects in WT mice. When GBR12909, a dopamine transport inhibitor, was administered intraperitoneally, it induced wakefulness in WT mice in a dose-dependent manner, but its arousal effect was attenuated to one-third in the D(2)R KO mice. However, these 2 genotypes showed an identical response in terms of sleep rebound after 2, 4, and 6 h of sleep deprivation. These results indicate that D(2)R plays an essential role in the maintenance of wakefulness, but not in homeostatic regulation of NREM sleep.
Figures
Similar articles
-
Dopaminergic D1 and D2 receptors are essential for the arousal effect of modafinil.J Neurosci. 2008 Aug 20;28(34):8462-9. doi: 10.1523/JNEUROSCI.1819-08.2008. J Neurosci. 2008. PMID: 18716204 Free PMC article.
-
Behavioral sleep-wake homeostasis and EEG delta power are decoupled by chronic sleep restriction in the rat.Sleep. 2015 May 1;38(5):685-97. doi: 10.5665/sleep.4656. Sleep. 2015. PMID: 25669184 Free PMC article.
-
Behavioral state instability in orexin knock-out mice.J Neurosci. 2004 Jul 14;24(28):6291-300. doi: 10.1523/JNEUROSCI.0586-04.2004. J Neurosci. 2004. PMID: 15254084 Free PMC article.
-
Histamine in the regulation of wakefulness.Sleep Med Rev. 2011 Feb;15(1):65-74. doi: 10.1016/j.smrv.2010.06.004. Epub 2010 Sep 20. Sleep Med Rev. 2011. PMID: 20851648 Free PMC article. Review.
-
Systematic review/meta-analysis on the role of CB1R regulation in sleep-wake cycle in rats.J Evid Based Med. 2024 Dec;17(4):714-728. doi: 10.1111/jebm.12643. Epub 2024 Sep 26. J Evid Based Med. 2024. PMID: 39325651 Free PMC article.
Cited by
-
Impulse Control Disorders in Parkinson's Disease: From Bench to Bedside.Front Neurosci. 2021 Mar 12;15:654238. doi: 10.3389/fnins.2021.654238. eCollection 2021. Front Neurosci. 2021. PMID: 33790738 Free PMC article. Review.
-
Eurycoma longifolia (Tongkat Ali) supplementation enhances sleep and wake consolidation in wild-type, but not in narcoleptic mice.Sleep Adv. 2024 Jul 10;5(1):zpae047. doi: 10.1093/sleepadvances/zpae047. eCollection 2024. Sleep Adv. 2024. PMID: 39055967 Free PMC article.
-
The role of intracerebral dopamine D1 and D2 receptors in sleep-wake cycles and general anesthesia.Ibrain. 2022 Feb 21;8(1):48-54. doi: 10.1002/ibra.12024. eCollection 2022 Spring. Ibrain. 2022. PMID: 37786416 Free PMC article. Review.
-
Behavioral Modulation by Spontaneous Activity of Dopamine Neurons.Front Syst Neurosci. 2017 Dec 11;11:88. doi: 10.3389/fnsys.2017.00088. eCollection 2017. Front Syst Neurosci. 2017. PMID: 29321731 Free PMC article. Review.
-
Role of Basal Ganglia in sleep-wake regulation: neural circuitry and clinical significance.Front Neuroanat. 2010 Nov 23;4:145. doi: 10.3389/fnana.2010.00145. eCollection 2010. Front Neuroanat. 2010. PMID: 21151379 Free PMC article.
References
-
- Arnulf I, Konofal E, Merino-Andreu M, Houeto JL, Mesnage V, Welter ML, Lacomblez L, Golmard JL, Derenne JP, Agid Y. Parkinson's disease and sleepiness: an integral part of PD. Neurology. 2002;58:1019–1024. - PubMed
-
- Basheer R, Halldner L, Alanko L, McCarley RW, Fredholm BB, Porkka-Heiskanen T. Opposite changes in adenosine A1 and A2A receptor mRNA in the rat following sleep deprivation. Neuroreport. 2001;12:1577–1580. - PubMed
-
- de Saint Hilaire Z, Orosco M, Rouch C, Blanc G, Nicolaidis S. Variations in extracellular monoamines in the prefrontal cortex and medial hypothalamus after modafinil administration: a microdialysis study in rats. Neuroreport. 2001;12:3533–3537. - PubMed
-
- Doi M, Yujnovsky I, Hirayama J, Malerba M, Tirotta E, Sassone-Corsi P, Borrelli E. Impaired light masking in dopamine D2 receptor-null mice. Nat Neurosci. 2006;9:732–734. - PubMed
-
- Franklin KBJ, Paxinos G. The mouse brain in stereotaxic coordinates. San Diego: Academic; 1997.
Publication types
MeSH terms
Substances
LinkOut - more resources
Full Text Sources
Molecular Biology Databases
Research Materials