. 2010 Mar 24;30(12):4440-8.
doi: 10.1523/JNEUROSCI.5062-09.2010.

The subthreshold relation between cortical local field potential and neuronal firing unveiled by intracellular recordings in awake rats

Affiliations

The subthreshold relation between cortical local field potential and neuronal firing unveiled by intracellular recordings in awake rats

Michael Okun et al. J Neurosci. .

Abstract

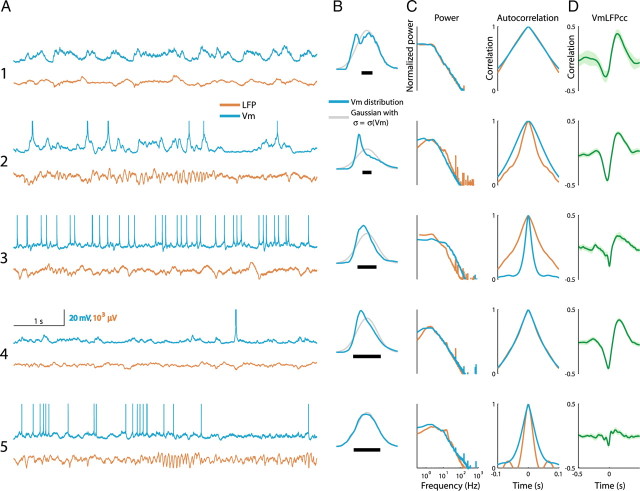
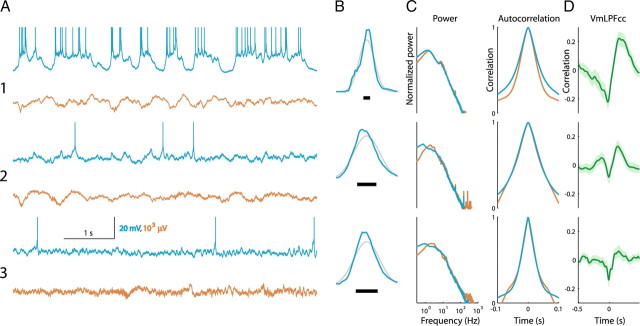
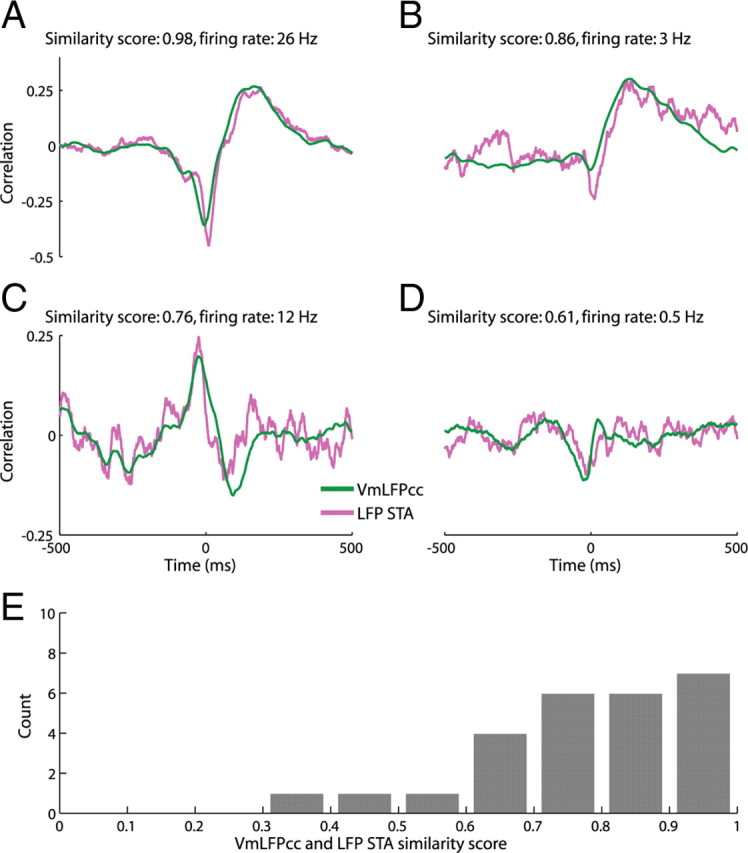
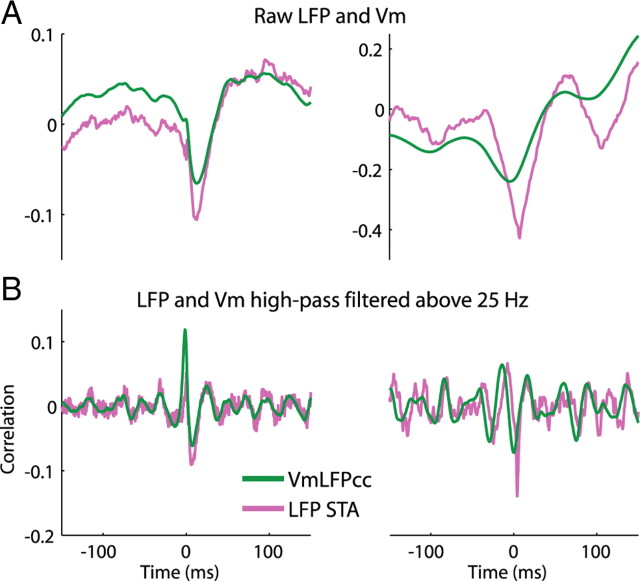
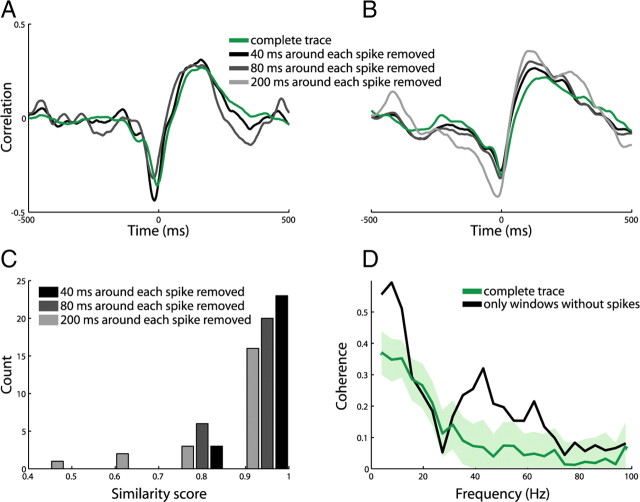
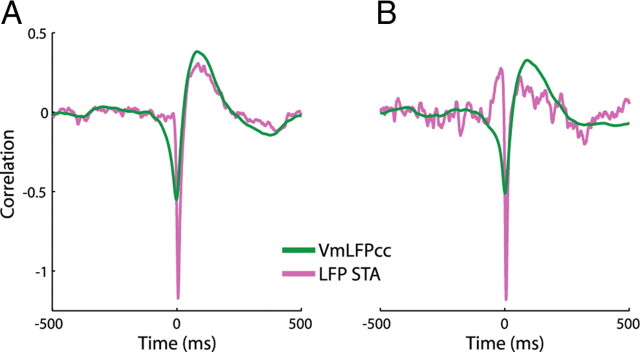
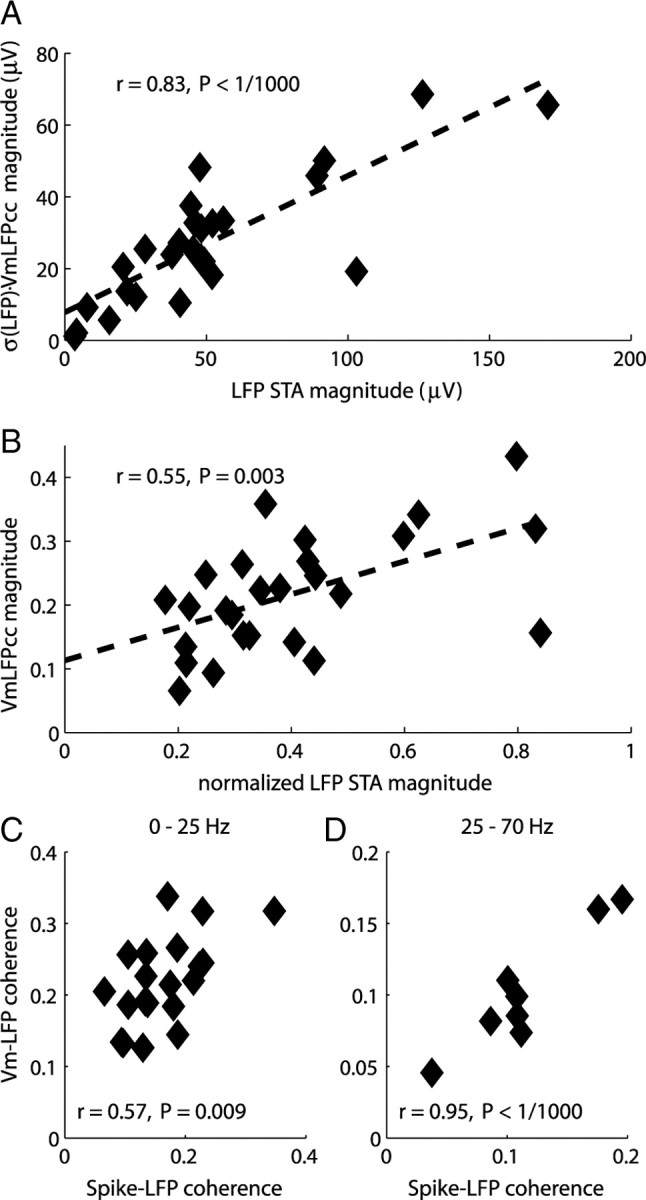
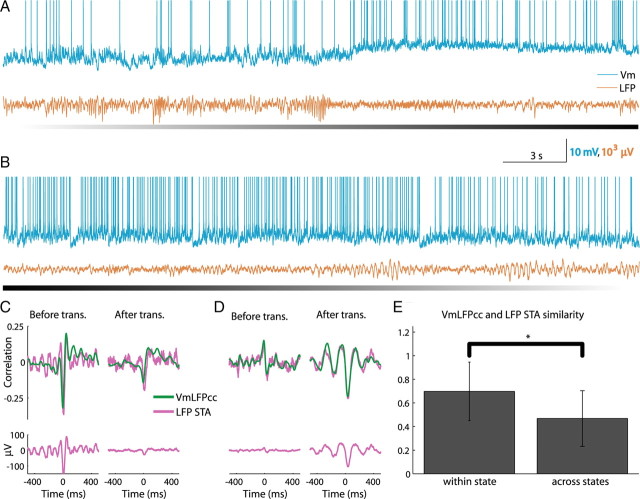
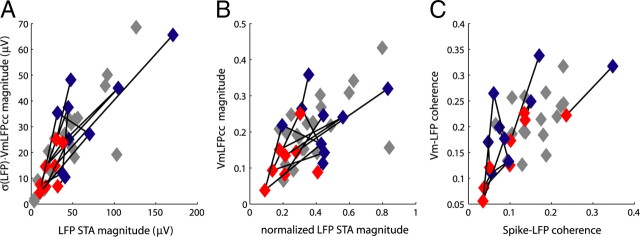
In most of the in vivo electrophysiological studies of cortical processing, which are extracellular, the spike-triggered local field potential average (LFP STA) is the measure used to estimate the correlation between the synaptic inputs of individual neuron and the local population. To understand how the magnitude and shape of LFP STA reflect the underlying correlation of synaptic activities, the membrane potential of the firing neuron has to be recorded together with the LFP. Using intracellular recordings from the cortex of awake rats, we found that for a large range of firing rates and for different behavioral states, the LFP STA represents both in its waveform and its magnitude the cross-correlation between the membrane potential of the neuron and the LFP. This data, supported by further analysis, suggests that LFP STA does not represent large network events specific to the spike times, but rather the synchrony between the mean synaptic activity of the population and the membrane potential of the single neuron, present both around spike times and in the intervals between spikes. Furthermore, it introduces a novel interpretation of the available data from unit and LFP extracellular recording experiments.


Figures

Figure 1.
Figure 1.
Vm and LFP recordings in rat S1 exhibit a rich repertoire of network dynamics. A, Examples of Vm and nearby LFP simultaneous recordings in 5 different neurons. Spikes are clipped. B, The Vm distributions. For comparison, a normal distribution having the same SD is shown. The scale bar below each distribution is 5 mV. The Vm distributions vary from bimodal, as in neuron 1, to normal, as in neuron 5. C, The power and autocorrelation of the Vm and the LFP signals, normalized to have a unit SD. D, Cross-correlation between Vm and LFP. Shaded region shows the 95% confidence limits. (The examples presented in each of the Figs. 1–4, and 8 are from distinct neurons.)
Figure 2.
Figure 2.
Vm and LFP recordings in rat PFC exhibit a rich repertoire of network dynamics. The figure is in the same format as Figure 1, presenting 3 examples of simultaneous Vm and nearby LFP recordings performed in the PFC.
Figure 3.
Figure 3.
In awake rats LFP STA and VmLFPcc have similar waveform. A–D, Examples of VmLFPcc and scaled LFP STAs in 4 neurons. The neuron in B was recorded in PFC, the rest in S1. E, Distribution of the similarity scores (see Materials and Methods) between LFP STA and VmLFPcc in all the analyzed neurons (n = 26).
Figure 4.
Figure 4.
VmLFPcc and LFP STA waveform similarity extends to gamma frequencies. A, Examples of VmLFPcc and scaled LFP STA in S1 and PFC neurons (as in Fig. 3A–D). The firing rates of the neurons were 12 and 8 Hz, respectively. B, VmLFPcc and LFP STA for the same two neurons, computed after the signals were digitally (offline) high-pass filtered >25 Hz.
Figure 5.
Figure 5.
VmLFPcc is not determined by intervals around spikes. A, B, Examples of VmLFPcc based on the entire traces (green) and cross-correlations in which points that are <20, 40, or 100 ms away from a spike were not included in the computation (gray) (see Materials and Methods). The neuron in A is presented in Figure 3A and the neuron in B is presented in Figure 1A3. For the neuron in A, which had a firing rate of 26 Hz, the removal of a 200 ms interval around each spike left <5% of the data points, hence we did not check their temporal relationship with the LFP. C, Distribution of the similarity score between the VmLFPcc and cross-correlations in which points that are <20, 40, or 100 ms away from a spike were not included in the computation, in all the analyzed neurons (n = 26). D, Vm-LFP coherence computed using 0.2 s windows and 3 tapers for the neuron presented in B. The coherence was computed using all the windows (green) and only windows without spikes (black). Similarly to this neuron, in all the neurons whose firing rate allowed to perform this test (e.g., the firing rate of neuron in A was such that <5% of the windows contained no spikes), either there was no significant difference between the two, or the coherence of the entire trace was lower (data not shown).
Figure 6.
Figure 6.
Under deep anesthesia precise spike-LFP locking is common. Examples showing that the waveforms of VmLFPcc and LFP STA in animals under deep halothane anesthesia are distinct. These two cells (which are shown only here and are not part of any other analysis) exhibit the case where a large portion of the spikes has a tight temporal relation with the LFP signal. The firing rates of the neurons were ∼6 Hz (A) and ∼1 Hz (B). The ratios between absolute peaks of LFP STA and VmLPFcc in the figure (after both were normalized to have the same Euclidian norm) are 2.1 and 2.3, respectively.
Figure 7.
Figure 7.
LFP STA and VmLFPcc are correlated in magnitude. A, The magnitudes of VmLPFcc scaled by LFP SD and of LFP STA, both quantified by the value of their absolute peak, are significantly correlated. The dashed line shows the linear regression (y = 0.38x + 7.8). B, The magnitudes of VmLPFcc and of normalized LFP STA, quantified by the value of their absolute peak, are significantly correlated. The dashed line shows the linear regression (y = 0.26x + 0.11). The reduction in the correlation between the two measures (compared to A) is expected, as in A both coordinates are multiplied by LFP SD. C, D, The Vm-LFP and spike-LFP coherences are correlated, both in the low (C) and gamma (D) frequency bands. Only neurons in which both the Vm-LFP and spike-LFP coherences were significant in more than half of the frequency band (see Materials and Methods) were included. Including all the neurons would have further increased the correlation.
Figure 8.
Figure 8.
Shape correlations between LFP STA and VmLFPcc are preserved during transitions between different states of cortical activity. A, B, Examples of simultaneous Vm and nearby LFP recordings in S1 during state transitions. In A, the transition is from a slow to fast activity, these transitions are typically abrupt. In B, the transition is from fast to slow activity, such transitions are usually more gradual. The bars below indicate the transition direction, from slow (white) to fast (black) or vice versa. The firing rates of the two neurons before and after the transition were 2.4, 5.7, and 15.4, 5.9 Hz, respectively. C, D, VmLFPcc and scaled LFP STA for the two neurons in A, B, before and after the transition. The LFP STA is shown again below in μV. Data were computed from (50, 35) seconds before and (84, 39) seconds after the transitions, respectively. E, The VmLFPcc waveform is more similar to the LFP STA waveform in the same state than to the LFP STA in a different state (data from 13 state transitions, p = 0.002, nonpaired t test).
Figure 9.
Figure 9.
Magnitude correlations between LFP STA and VmLFPcc are preserved during transitions between different states of cortical activity. The magnitudes of VmLFPcc and LFP STA vary together during state transitions. The connected blue and red points represent the slower and the faster activities recorded in the same neuron, respectively. A, The magnitudes of VmLPFcc scaled by LFP SD and of LFP STA. For comparison, the points from Figure 7A are shown in the background (gray). Note that the transitions cover a large range of the population. B, The magnitudes of VmLPFcc and of normalized LFP STA. For comparison, the points from Figure 7B are shown in the background (gray). C, The Vm-LFP coherence and spike-LFP coherence in the 0–25 Hz band. For comparison, the points from Figure 7C are shown in the background (gray).

References

    1. Averbeck BB. Poisson or not Poisson: differences in spike train statistics between parietal cortical areas. Neuron. 2009;62:310–311. - PubMed
    1. Buzsaki G. Rhythms of the brain. New York: Oxford UP; 2006.
    1. de Kock CP, Bruno RM, Spors H, Sakmann B. Layer- and cell-type-specific suprathreshold stimulus representation in rat primary somatosensory cortex. J Physiol. 2007;581:139–154. - PMC - PubMed
    1. Destexhe A, Contreras D, Steriade M. Spatiotemporal analysis of local field potentials and unit discharges in cat cerebral cortex during natural wake and sleep states. J Neurosci. 1999;19:4595–4608. - PMC - PubMed
    1. Deweese MR, Zador AM. Shared and private variability in the auditory cortex. J Neurophysiol. 2004;92:1840–1855. - PubMed

Publication types