. 2010 May 15;21(10):1714-24.
doi: 10.1091/mbc.e10-01-0011. Epub 2010 Mar 24.

The spectraplakin Short stop is an actin-microtubule cross-linker that contributes to organization of the microtubule network

Affiliations

The spectraplakin Short stop is an actin-microtubule cross-linker that contributes to organization of the microtubule network

Derek A Applewhite et al. Mol Biol Cell. .

Erratum in

  • Mol Biol Cell. 2010 Jun 15;21(12):2097. Zadeh, Alireza [corrected to Zadeh, Alireza Dehghani]

Abstract

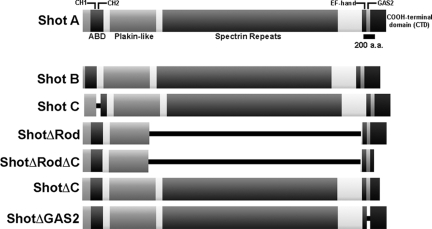
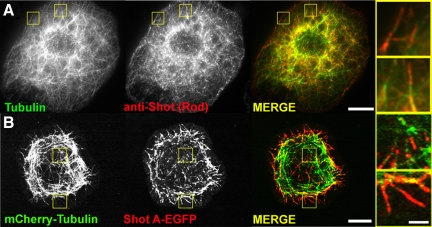
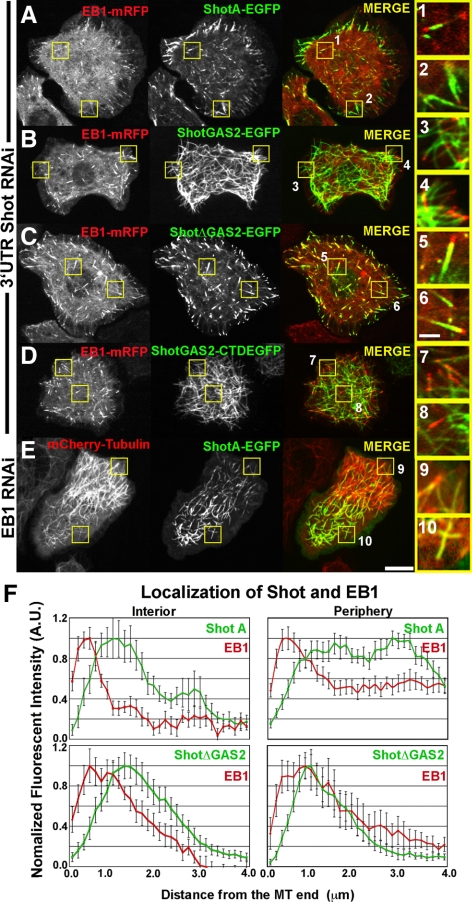
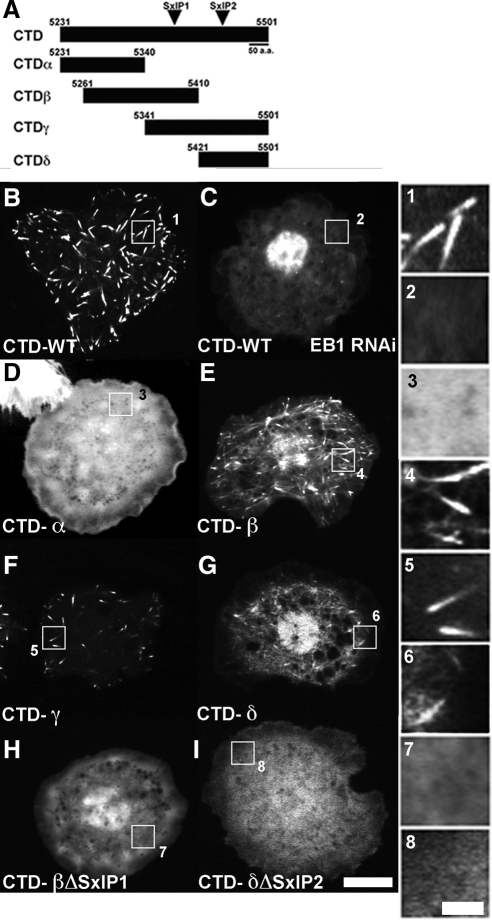
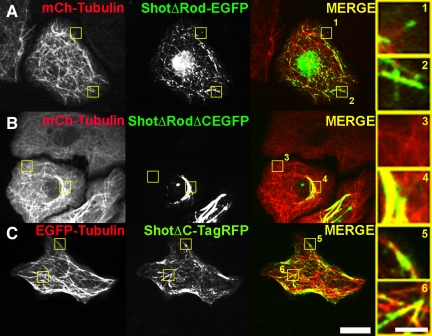
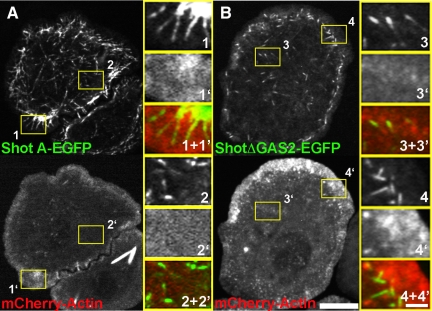
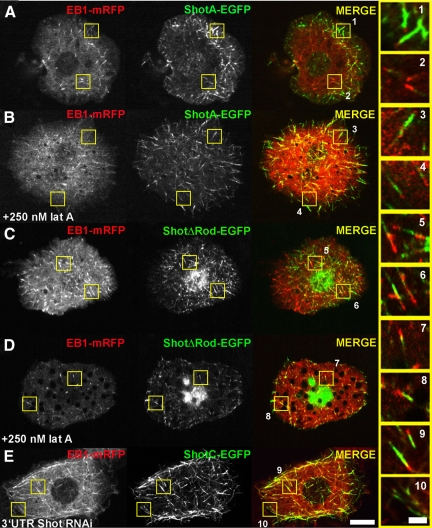
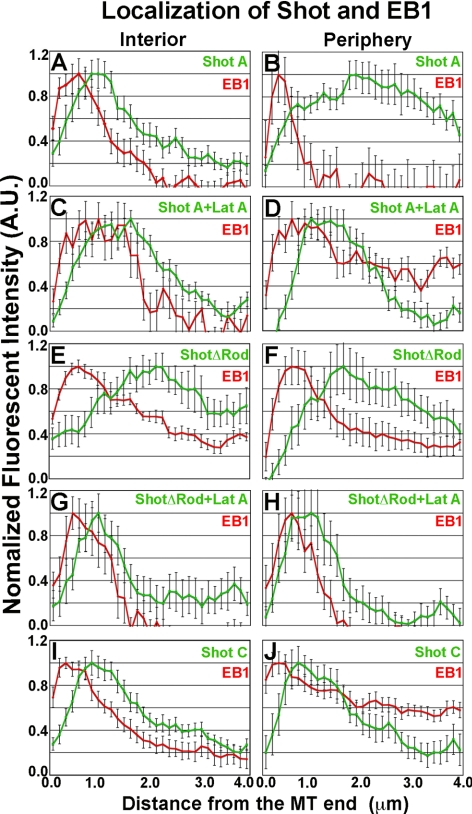
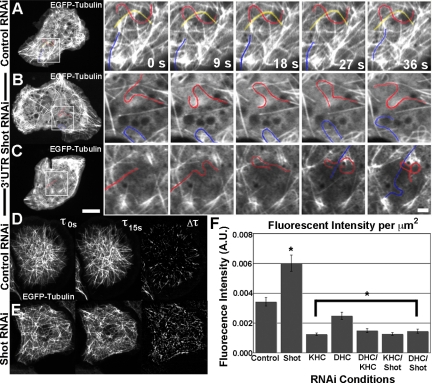
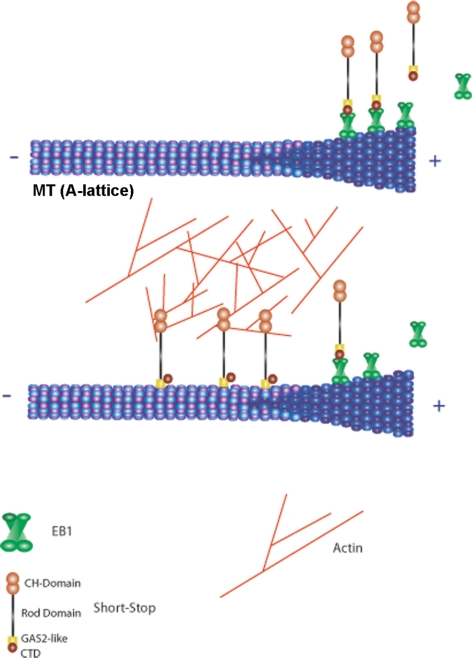
The dynamics of actin and microtubules are coordinated in a variety of cellular and morphogenetic processes; however, little is known about the molecules mediating this cytoskeletal cross-talk. We are studying Short stop (Shot), the sole Drosophila spectraplakin, as a model actin-microtubule cross-linking protein. Spectraplakins are an ancient family of giant cytoskeletal proteins that are essential for a diverse set of cellular functions; yet, we know little about the dynamics of spectraplakins and how they bridge actin filaments and microtubules. In this study we describe the intracellular dynamics of Shot and a structure-function analysis of its role as a cytoskeletal cross-linker. We find that Shot interacts with microtubules using two different mechanisms. In the cell interior, Shot binds growing plus ends through an interaction with EB1. In the cell periphery, Shot associates with the microtubule lattice via its GAS2 domain, and this pool of Shot is actively engaged as a cross-linker via its NH(2)-terminal actin-binding calponin homology domains. This cross-linking maintains microtubule organization by resisting forces that produce lateral microtubule movements in the cytoplasm. Our results provide the first description of the dynamics of these important proteins and provide key insight about how they function during cytoskeletal cross-talk.


Figures

Figure 1.
Figure 1.
Schematic Representation of Shot, its isoforms, and deletion constructs. (A) Schematic diagram of Shot A is given. The Shot A, B, and C isoforms vary at their NH2 terminus while having identical central and COOH-terminal domains. The Shot C isoform differs having only one CH domain. ShotΔRod, ShotΔRodΔC, ShotΔC, and ShotΔGAS2 are derived from Shot A. All constructs are COOH EGFP-tagged unless otherwise noted.
Figure 2.
Figure 2.
Shot's localization by immunostaining and live cell imaging. (A) An S2 cell fixed and stained for endogenous α-tubulin (left, green in merged image) and Shot (middle, red in merged image). Regions shown at higher magnification (far right) are indicated by yellow boxes in low-magnification images. (B) An S2 cell expressing mCherry-Tubulin (left, green in merged image) and Shot A-EGFP (middle, red in merged image). Regions shown at higher magnification (far right) are indicated by yellow boxes in low magnification images. Bars, 10 μm in low-magnification images and 2 μm in high-magnification images.
Figure 3.
Figure 3.
Shot has two distinct modes of interacting with microtubules. (A) An S2 cell cotransfected with EB1-mRFP (left, red in merged image) and full-length Shot A (middle, green in merged image) after depletion of endogenous Shot using RNAi designed against the 3′-UTR of Shot. High-magnification images to the far right highlight Shot A and EB1 in the interior (1) and perimeter (2). (B) An S2 cell expressing EB1-mRFP (left, red in merged image) and the GAS2 domain of Shot (middle, green in merged image) after RNAi depletion of endogenous Shot. High-magnification images (3 and 4, far right) demonstrate that the GAS2 binds along the lattice of microtubules and does not plus end track. (C) EB1-mRFP (left, red in merged image) and ShotAΔGAS2 (middle, green in merged image) coexpressed in an S2 cell after depletion of endogenous Shot by RNAi against 3′-UTR of Shot. Higher magnification images (5 and 6, far right) demonstrate that ShotAΔGAS2 plus end tracks and does not bind to the lattice. (D) An S2 cell coexpressing EB1-mRFP (left, red in merged image) and ShotGAS2-CTD (middle, green in merged image) after depletion of endogenous Shot. Higher magnification images (7 and 8 far right) indicate that despite having the EB1 binding CTD, the GAS2 domain targets this fusion to the microtubule lattice. (E) An S2 cells expressing mCherry-Tubulin (left, red in merged image) and Shot A after RNAi depletion of EB1. High-magnification images (9 and 10, far right) indicate that ShotA maintains lattice association despite loss of +TIP association. (F) Graphical representations of line scans plotting the distribution of Shot (green) and EB1 (red) at the cell interior (top left), Shot A and EB1 at the cell periphery (top right), and ShotΔGAS2 and EB1 in the cell interior (bottom left) and at the cell periphery (bottom right), with their distributions being very similar at the two locations. For each graph, the average fluorescence intensity of 10–15 individual microtubules was plotted against the distance from the microtubule end. Two populations where measured, in the cell interior and at the cell periphery (1–5 μm in from the cell margin). Bar 10 μm (low-magnification images) and 2 μm (high-magnification images) (far right).
Figure 4.
Figure 4.
The COOH-terminal domain contains tandem SxIP motifs required for plus end tracking. (A) Schematic representation of the various fusion proteins we generated in order to isolate the SxIP motifs. (B–I) S2 cells transfected with the various EGFP or mCherry fusion proteins outlined in B. (B) CTD-WT (EGFP) expressed in an S2 cell. (C) CTD-WT (EGFP) expressed in an S2 cell after depletion of EB1, under these conditions the CTD of Shot does not plus end track. (D) CTD-α (EGFP). (E) CTD-β (EGFP). (F) CTD-γ (EGFP). (G) CTD-δ (mCherry). (H) CTD-β (EGFP) containing a deletion of the first SxIP motif (residues 5377-5380). (I) CTD-δ (mCherry) containing a deletion in the second SxIP motif (residues 5438-5445). (1–8) Higher magnification images corresponding to the lower magnification images pictured in B-I. Bar, 10 μm (low-magnification images) and 2 μm (high-magnification images).
Figure 5.
Figure 5.
Partial deletion of the CTD ablates plus end tracking. (A) Shown in low-magnification images, an S2 cell cotransfected with mCherry-Tubulin (left, red in merge) and ShotΔRod-EGFP (middle, green in merge). Regions 1 and 2, shown at higher magnification (far right), are indicated by yellow boxes in the lower magnification image. ShotΔRod-EGFP both binds to the lattice of MT as well as plus end tracks. (B) Lower magnification images show mCherry-Tubulin (left, red in merged image) and ShotΔRodΔC-EGFP (middle, green in merged image). Regions 3 and 4 are shown at higher magnification, far right. ShotΔRodΔC-EGFP fails to plus in track but does associate with MT lattice. (C) Shown lower magnification an S2 cell coexpressing EGFP-Tubulin (left, red in merged image) and ShotΔC-TagRFP. Far right, higher magnification images (5 and 6, indicated by yellow boxes in low magnification images) demonstrates that ShotΔC, similar to ShotΔRodΔC, is unable to plus end track but retains residual MT lattice binding. Bars, 10 μm (low-magnification images) and 2 μm (high-magnification images).
Figure 6.
Figure 6.
Shot's lattice binding corresponds to peripheral actin-rich regions of the cell. (A) An S2 cell cotransfected with Shot A-EGFP (top) and mCherry-Actin (bottom). Regions shown at higher magnification (1–1′ and 2–2′) are indicated by the yellow boxes in lower magnification images. At the cell periphery (right, 1 and 1′), Shot is localizing along the length of the microtubules that have entered a region of increased actin fluorescent intensity. In contrast, in the cell interior (2 and 2′) Shot is restricted to the tips of microtubules where the actin fluorescent intensity is low. (B) An S2 cell transfected with ShotΔGAS2-EGFP (top) and mCherry-Actin (bottom). Regions shown at higher magnification are indicated with yellow boxes (3–3′ and 4–4′). ShotΔGAS2- EGFP fails to decorate along the length of microtubules in the cell interior (3 and 3′) or at the cell periphery despite the increased actin fluorescent intensity (4 and 4′). Bars, 10 μm (low-magnification images) and 2 μm (high-magnification images).
Figure 7.
Figure 7.
Shot's lattice binding is actin-dependent. (A–E) S2 cells coexpressing EB1-mRFP (left panels, red in merged images, right) and full-length Shot A-EGFP (A and B), ShotΔRod-EGFP (C and D), or Shot C-EGFP (E) (middle, green in merged images, right). (A) Shot preferentially binds along the lattice at the actin-rich periphery, but displays +TIP dynamics in the cell interior. (B) After perfusion with Lat A, which depolymerizes actin, Shot's localization shifts relative to EB1 and the lattice bound population is decreased. (C) ShotΔRod-EGFP demonstrates both lattice and +TIP behavior everywhere in the cell. (D) ShotΔRod also shifts to a more +TIP-like distribution after perfusion of Lat A. (E) The C isoform of Shot contains a single CH domain and binds actin much more weakly than the A isoform as a result the ShotC isoform's localization is more similar to that of EB1. Bar, 10 μm. (1–10) Higher magnification images of regions specified in lower magnification images (A–E). Bar, 2 μm.
Figure 8.
Figure 8.
Quantification of Shot's localization in the cell interior or at the cell periphery. Graphical representations of line scans of EB1(red) and Shot derivative fusion proteins (green) from images represented in Figure 7. For each graph, the average fluorescence intensity of 10–15 individual microtubules was plotted against the distance from the microtubule end. Two populations where measured, in the cell interior and at the cell periphery (1–5 μm in from the cell margin). (A–D) The distribution of full-length Shot and EB1 are quantified in the cell interior (A) and at the cell periphery (B) as well the resulting shift in distribution after perfusion with 250 nM Lat A (C and D). (E–H) Quantification of the distribution of EB1 and ShotΔRod before perfusion Lat A (E and F) and after the treatment (G and H). Quantified in I and J are the distributions of EB1 and the ShotC isoform in the cell interior (I) and periphery (J) after depletion of endogenous Shot by RNAi.
Figure 9.
Figure 9.
Shot depletion leads to microtubule fish-tailing. (A–C) Time-lapsed stills of S2 cells transfected with EGFP-Tubulin after depletion by control RNAi (A) or 3′-UTR (B and C) of Shot. In lower magnification images (left), the region of higher magnification is indicated by white box. In higher magnification images (sequences to the right), individual microtubules are highlighted and followed over time. Bar, 10 μm (lower magnification images) and 2 μm (higher magnification images). (D and E) Method of quantification of the phenotype. In brief, S2 cells expressing mCherry-Tubulin were subtracted at 15-s intervals. The resulting fluorescence is an indicator of microtubule movement over the specified time period. This fluorescence was measured and normalized by size of the region of interest and quantified in F. (F) Quantification of fluorescence intensity per square micrometer after RNAi treatments. Asterisks indicate statistical significance as compared with control RNAi treated samples (p < 0.03, Student's t test) For each condition, five to 20 different cells were measured (a minimum of 80 data points); error bars represent SE.
Figure 10.
Figure 10.
Shot's conversion from +Tip tracking to lattice binding/cross-linking is dependent on actin binding. (Top) Shot plus end tracks, similarly to other EB1 dependent plus end tracking proteins in the interior of the cell. (Bottom) Once Shot's CH domains bind actin, Shot's dynamic shifts binding along the lattice of microtubules and functionally cross-linking actin to microtubules. This mode of Shot's dynamics is EB1 independent.

References

    1. Bernier G., Mathieu M., De Repentigny Y., Vidal S. M., Kothary R. Cloning and characterization of mouse ACF7, a novel member of the dystonin subfamily of actin binding proteins. Genomics. 1996;38:19–29. - PubMed
    1. Drabek K., et al. Role of CLASP2 in microtubule stabilization and the regulation of persistent motility. Curr. Biol. 2006;16:2259–2264. - PubMed
    1. Fukata M., Watanabe T., Noritake J., Nakagawa M., Yamaga M., Kuroda S., Matsuura Y., Iwamatsu A., Perez F., Kaibuchi K. Rac1 and Cdc42 capture microtubules through IQGAP1 and CLIP-170. Cell. 2002;109:873–885. - PubMed
    1. Gong T. W., Besirli C. G., Lomax M. I. MACF1 gene structure: a hybrid of plectin and dystrophin. Mamm. Genome. 2001;12:852–861. - PubMed
    1. Goode B. L., Wong J. J., Butty A. C., Peter M., McCormack A. L., Yates J. R., Drubin D. G., Barnes G. Coronin promotes the rapid assembly and cross-linking of actin filaments and may link the actin and microtubule cytoskeletons in yeast. J. Cell Biol. 1999;144:83–98. - PMC - PubMed

Publication types

LinkOut - more resources