. 2010 Apr;120(4):1043-55.
doi: 10.1172/JCI41376. Epub 2010 Mar 24.

Calorie restriction enhances cell adaptation to hypoxia through Sirt1-dependent mitochondrial autophagy in mouse aged kidney

Affiliations

Calorie restriction enhances cell adaptation to hypoxia through Sirt1-dependent mitochondrial autophagy in mouse aged kidney

Shinji Kume et al. J Clin Invest. 2010 Apr.

Abstract

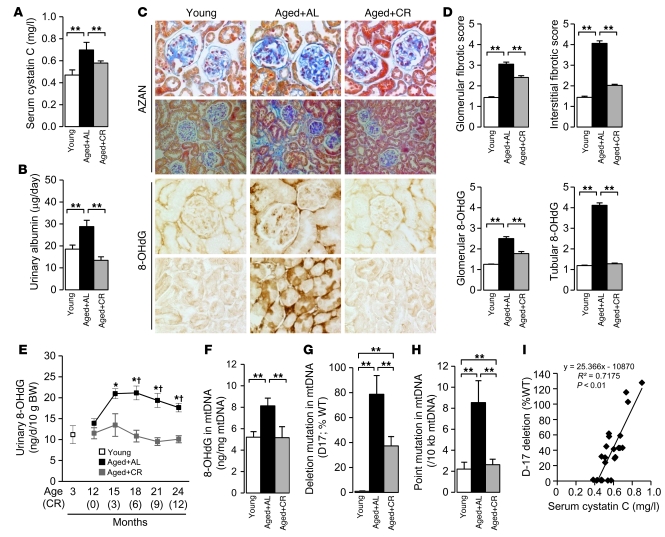
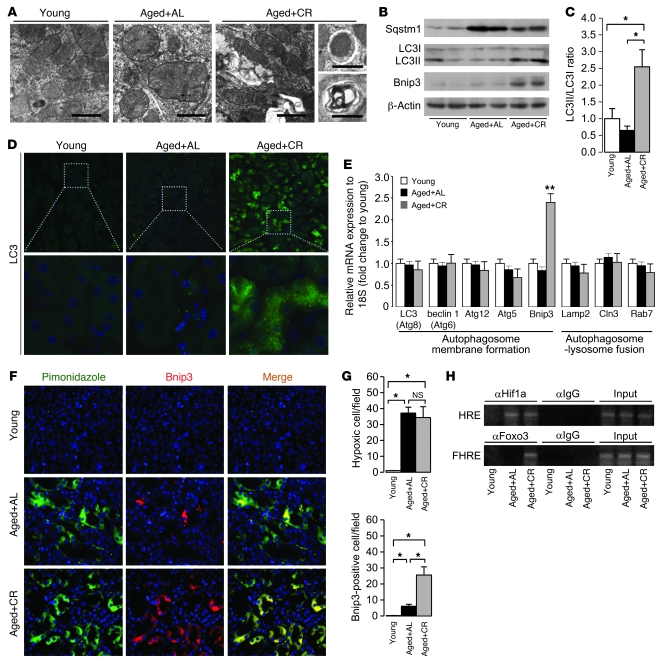
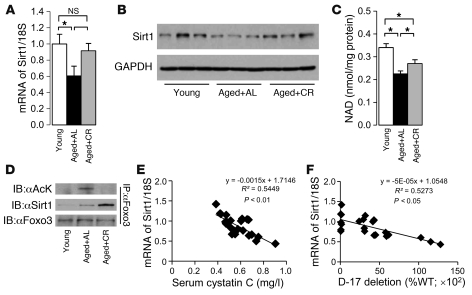
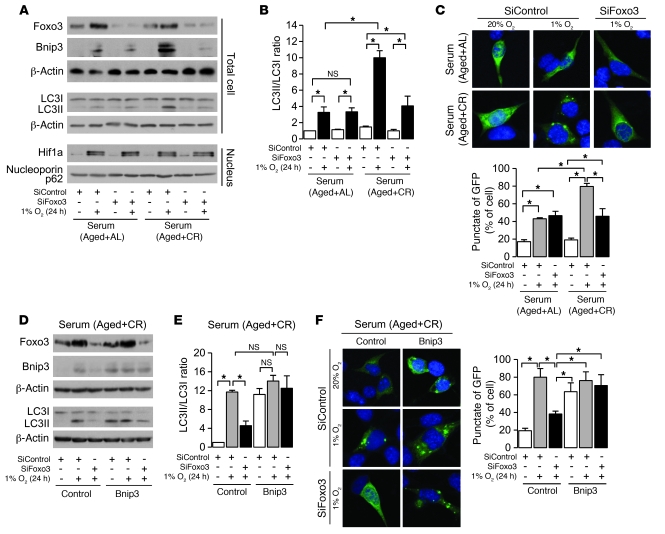
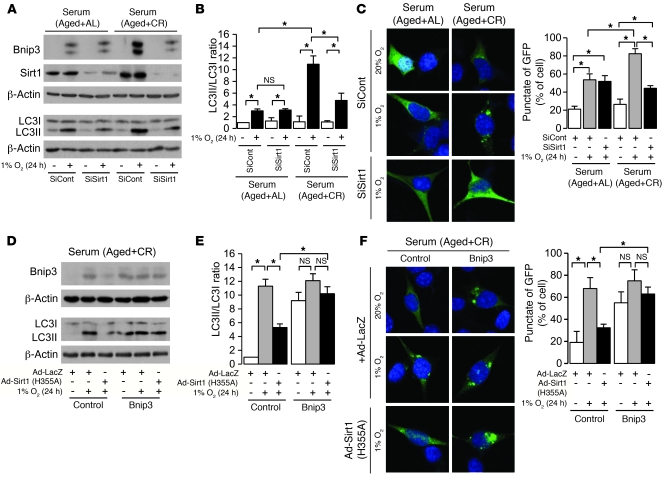
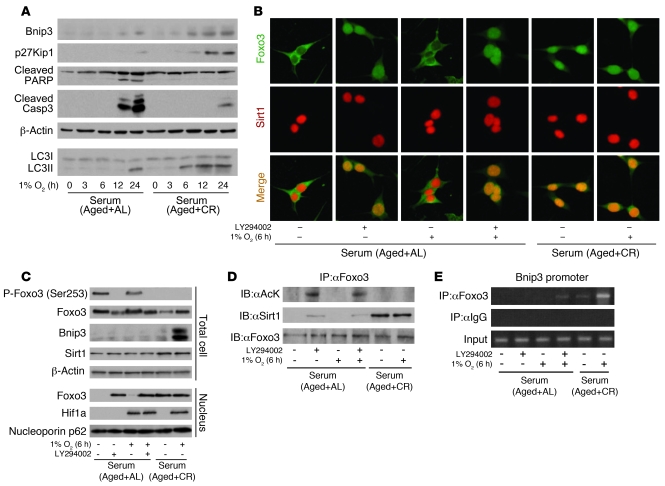
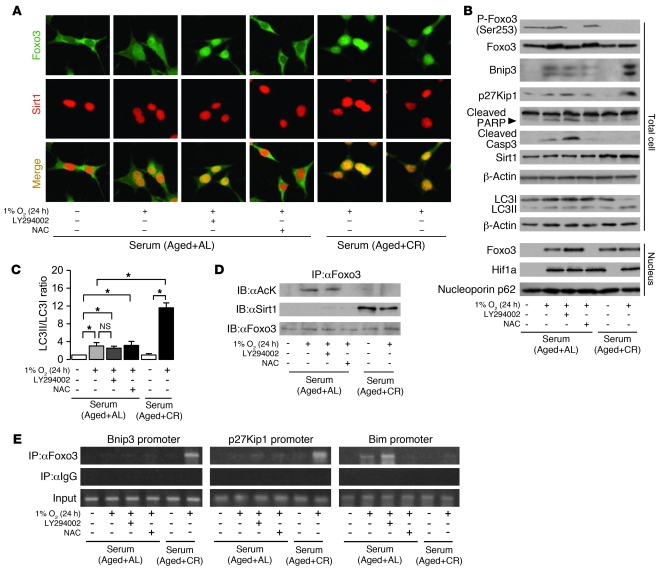
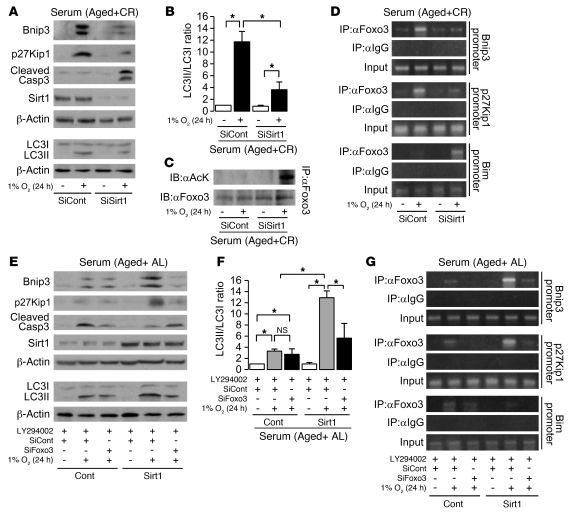
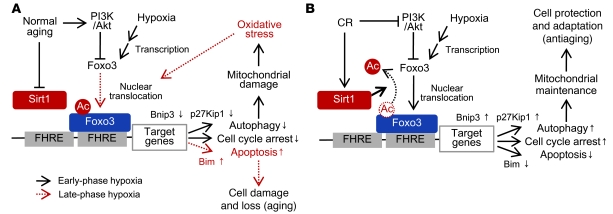
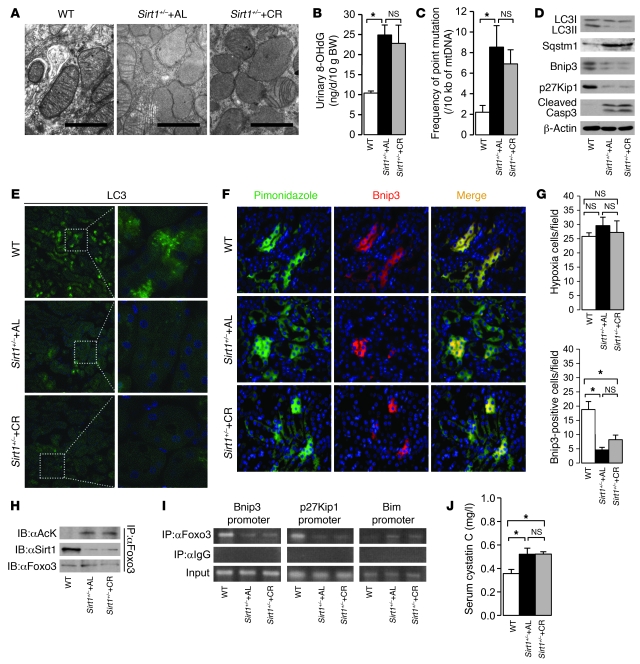
Mitochondrial oxidative damage is a basic mechanism of aging, and multiple studies demonstrate that this process is attenuated by calorie restriction (CR). However, the molecular mechanism that underlies the beneficial effect of CR on mitochondrial dysfunction is unclear. Here, we investigated in mice the mechanisms underlying CR-mediated protection against hypoxia in aged kidney, with a special focus on the role of the NAD-dependent deacetylase sirtuin 1 (Sirt1), which is linked to CR-related longevity in model organisms, on mitochondrial autophagy. Adult-onset and long-term CR in mice promoted increased Sirt1 expression in aged kidney and attenuated hypoxia-associated mitochondrial and renal damage by enhancing BCL2/adenovirus E1B 19-kDa interacting protein 3-dependent (Bnip3-dependent) autophagy. Culture of primary renal proximal tubular cells (PTCs) in serum from CR mice promoted Sirt1-mediated forkhead box O3 (Foxo3) deacetylation. This activity was essential for expression of Bnip3 and p27Kip1 and for subsequent autophagy and cell survival of PTCs under hypoxia. Furthermore, the kidneys of aged Sirt1+/- mice were resistant to CR-mediated improvement in the accumulation of damaged mitochondria under hypoxia. These data highlight the role of the Sirt1-Foxo3 axis in cellular adaptation to hypoxia, delineate a molecular mechanism of the CR-mediated antiaging effect, and could potentially direct the design of new therapies for age- and hypoxia-related tissue damage.


Figures

Figure 1
Figure 1. Effect of CR on mitochondrial oxidative damage in aged kidney.
Experiments were performed on young mice or on aged mice subjected to AL or 12 months of CR. (A and B) Serum cystatin C levels (A) and 24-hour urinary albumin excretion levels (B) at the end of the experimental period. (C) Azan-stained and 8-OHdG–immunostained kidney sections. Original magnification, ×200 (Azan, bottom); ×400 (Azan, top, and 8-OHdG). (D) Quantitative analyses of Azan and 8-OHdG staining of glomerular and tubulointerstitial lesions. (E) Urinary 8-OHdG excretion levels during the observation period. Data are mean ± SEM. *P < 0.05 vs. young, P < 0.05 vs. CR at the same time point. (FH) 8-OHdG content (F), relative proportion of D-17 deletions (as percentage of WT; G), and frequencies of point mutations in cytochrome b gene (H) in mtDNA isolated from the kidney. Data are mean ± SEM. **P < 0.05. Each group includes 7–9 mice. (I) Correlation between D-17 prevalence and serum cystatin C level.
Figure 2
Figure 2. Effect of CR on Bnip3-mediated autophagy in aged kidney.
(A) EM of representative renal PTCs. Scale bars: 1 μm. (B) IB analysis for autophagy-associated molecules. (C) Quantitative analysis of band intensity for LC3I and LC3II (ratio of LC3II to LC3I). (D) Immunofluorescent study for LC3 protein in the kidney. Original magnification, ×400 (top); ×1,000 (bottom). DAPI staining was performed as counterstaining. (E) mRNA expression associated with auto(lyso)phagosomal formation. Data are assessed as the ratio of mRNA expression of each molecule to mRNA expression of 18S ribosomal RNA and expressed as the fold change relative to the mean value of young mice. (F) Immunofluorescence study for pimonidazole and Bnip3 in the kidney. Original magnification, ×400. (G) Quantitative analysis of hypoxic pimonidazole+ and Bnip3+ cells per field in the kidney. (H) ChIP analysis to determine Hif1a and Foxo3 binding to Bnip3 promoter in the kidney samples. HRE, Hif-responsive element; FHRE, forkhead response element. Data are mean ± SEM. *P < 0.05. **P < 0.05 vs. other groups. Each group includes 7–9 mice.
Figure 3
Figure 3. Effect of CR on Sirt1 activity in aged kidney.
(A and B) mRNA (A) and protein (B) expression levels of Sirt1 in kidney samples. (C) NAD contents in kidney samples. (D) IP to detect acetylation of Foxo3 and interaction between Sirt1 and Foxo3 in kidney samples. Data are mean ± SEM. *P < 0.05. Each group includes 7–9 mice. (E) Correlation between Sirt1 mRNA expression level and serum cystatin C level. (F) Correlation between Sirt1 mRNA expression level and D-17 prevalence.
Figure 4
Figure 4. Involvement of Foxo3 on CR-mediated enhancement of autophagy under hypoxia.
(A) Expression of Foxo3, autophagy-associated molecules, and nuclear Hif1a under hypoxia (1% O2, 24 hours) in cells transfected with siRNA control or siRNA for Foxo3 under AL or CR serum. To detect LC3I and LC3II bands, cells were preincubated with lysosomal inhibitor (E64d and pepstatin A). (B) Quantitative analysis of the ratio of LC3II to LC3I (n = 4). (C) Hypoxia-induced autophagy in cells transfected with siRNA control or siRNA for Foxo3 in AL or CR serum. Autophagy was detected as dot spot of GFP-LC3 protein. Original magnification, ×400. Bottom: Percentage of GFP+ cells with punctate GFP-LC3 fluorescence. (D) Expression of Foxo3 and autophagy-associated molecules under hypoxia in retrovirally mediated Bnip3-overexpressing cells transfected with siRNA control or siRNA for Foxo3 in CR serum. To detect LC3I and LC3II bands, cells were preincubated as in A. (E) Quantitative analysis of the ratio of LC3II to LC3I (n = 4). (F) Hypoxia-induced autophagy in Bnip3-overexpressing cultured cells transfected with siRNA control or siRNA for Foxo3 in CR serum. Original magnification, ×400. Right: Percentage of GFP+ cells with punctate GFP-LC3 fluorescence. Data are mean ± SEM. *P < 0.05.
Figure 5
Figure 5. Involvement of Sirt1 in CR-mediated enhancement of autophagy under hypoxia.
(A) Bnip3 and Sirt1 expression and LC3II formation in retrovirally mediated Sirt1-knockdown cells under hypoxia (1% O2, 24 hours) in AL and CR serum conditions. To detect LC3I and LC3II bands, cells were preincubated with lysosomal inhibitor (E64d and pepstatin A). (B) Quantitative analysis of the ratio of LC3II to LC3I (n = 4). (C) Hypoxia-induced autophagy in Sirt1-knockdown cells under AL and CR serum conditions. Original magnification, ×400. Right: Percentage of GFP+ cells with punctate GFP-LC3 fluorescence. (D) Expression of Bnip3 and LCII formation under hypoxia in retrovirally mediated Bnip3-overexpressing cells infected with either adenoviral mutated Sirt1 (H355A) or LacZ in CR serum. To detect LC3I and LC3II bands, cells were preincubated as in A. (E) Quantitative analysis of the ratio of LC3II to LC3I (n = 4). (F) Hypoxia-induced autophagy in retrovirally mediated Bnip3-overexpressing cells infected with either adenoviral mutated Sirt1 (H355A) or LacZ in CR serum. Original magnification, ×400. Right: Percentage of GFP+ cells with punctate GFP-LC3 fluorescence. Data are mean ± SEM. *P < 0.05.
Figure 6
Figure 6. Involvement of PI3K and Sirt1 in Foxo3-mediated Bnip3 expression at early phase of hypoxia.
(A) IB for Bnip3, p27Kip1, cleaved PARP, and cleaved caspase 3 expression and LC3II formation at the indicated time points under hypoxia (1% O2) in AL and CR serum. To detect LC3I and LC3II bands, cells were preincubated with lysosomal inhibitor (E64d and pepstatin A). (B) Immunostaining showing localization of Foxo3 and Sirt1 at early phase of hypoxia (1% O2, 6 hours) under the indicated conditions. Original magnification, ×400. (C) Phosphorylation and expression levels of Foxo3, expression levels of Bnip3 and Sirt1, and nuclear expression levels of Foxo3 and Hif1a at early phase of hypoxia. (D) Acetylation of Foxo3 and interaction between Sirt1 and Foxo3 at early phase of hypoxia. (E) ChIP analysis to determine Foxo3 binding to Bnip3 promoters at early phase of hypoxia. LY294002 was used as PI3K inhibitor at 20 μM.
Figure 7
Figure 7. Involvement of PI3K and Sirt1 in Foxo3-mediated cell adaptation to hypoxia.
(A) Immunostaining showing localization of Foxo3 and Sirt1 at late phase of hypoxia (1% O2, 24 hours) under the indicated conditions. Original magnification, ×400. (B) Phosphorylation and expression level of Foxo3; expression of Bnip3, p27Kip1, cleaved PARP, cleaved caspase 3, and Sirt1; formation of LC3II; and nuclear expression levels of Foxo3 and Hif1a at late phase of hypoxia. To detect LC3I and LC3II bands, cells were preincubated with lysosomal inhibitor (E64d and pepstatin A). (C) Quantitative analysis of the ratio of LC3II to LC3I (n = 4). (D) Acetylation of Foxo3 and interaction between Sirt1 and Foxo3 at late phase of hypoxia. (E) ChIP analysis to determine Foxo3 binding to the promoters of Bnip3, p27Kip1, and Bim at late phase of hypoxia. LY294002 was used as a PI3K inhibitor at 20 μM. NAC was used as an antioxidant at 20 mM. Data are mean ± SEM. *P < 0.05.
Figure 8
Figure 8. Role of Sirt1 in cell adaptation to hypoxia.
(A) Expression levels of Bnip3, p27Kip1, cleaved caspase 3, and Sirt1 and formation of LC3II in retrovirally mediated Sirt1-knockdown cells under hypoxia (1% O2, 24 hours) in CR serum condition. To detect LC3I and LC3II bands, cells were preincubated with lysosomal inhibitor (E64d and pepstatin A). (B) Quantitative analysis of the ratio of LC3II to LC3I (n = 4). (C) Acetylation of Foxo3 in Sirt1-knockdown cells under hypoxia in CR serum. (D) ChIP analysis to determine Foxo3 binding to promoters of Bnip3, p27Kip1, and Bim in Sirt1-knockdown cells under hypoxia in CR serum. (E) Expression levels of Bnip3, p27Kip1, cleaved caspase 3, and Sirt1 and formation of LC3II in retrovirally mediated Sirt1-overexpressing cells transfected with siRNA control or siRNA for Foxo3 under hypoxia in AL serum. To detect LC3I and LC3II bands, cells were preincubated as in A. (F) Quantitative analysis of the ratio of LC3II to LC3I (n = 4). (G) ChIP analysis to determine Foxo3 binding to promoters of Bnip3, p27Kip1, and Bim in Sirt1-overexpressing cells transfected with siRNA control or siRNA for Foxo3 under hypoxia in AL serum. LY294002 was used as a PI3K inhibitor at 20 μM. Data are mean ± SEM. *P < 0.05.
Figure 10
Figure 10. Molecular mechanisms underlying CR-mediated cellular adaptation to hypoxia in aged kidney.
(A) The normal aging process inhibits Sirt1 activity. During early-stage hypoxia, hypoxia fails to enhance nuclear translocation of Foxo3, subsequent autophagy, and cell cycle arrest, which increases mitochondrial oxidative damage (black lines). At late-phase hypoxia, hypoxia-associated oxidative stress activates nuclear translocation of acetylated Foxo3, which promotes apoptosis (red lines). (B) CR activates Sirt1 activity and nuclear translocation of Foxo3, which promotes autophagy and cell cycle arrest under hypoxia to maintain normal mitochondria function under hypoxia.
Figure 9
Figure 9. Effect of CR on Foxo3-mediated cell adaptation in the kidneys of aged Sirt1+/– mice.
We examined 12-month-old WT mice, Sirt1+/– AL mice, and Sirt1+/– mice on CR for 6 months. (A) EM of a renal PTC. Scale bars: 1 μm. (B) Urinary 8-OHdG excretion. (C) Frequency of point mutation of mtDNA in the kidney. (D) LC3II formation and expression levels of Sqstm1, Bnip3, p27Kip1, and cleaved caspase 3 in the kidney. (E) Immunofluorescence study for LC3 protein in the kidney. Original magnification, ×400 (left); ×1,000 (right). (F) Immunofluorescence study for pimonidazole and Bnip3 in a kidney section. Original magnification, ×400. (G) Quantitative analysis of hypoxic pimonidazole+ and Bnip3+ cells per field in the kidney. (H) Acetylation of Foxo3 and interaction between Sirt1 and Foxo3 in the kidney. (I) ChIP analysis to determine Foxo3 binding to the binding site in the Bnip3, p27Kip1, and Bim promoters in the kidney. (J) Serum cystatin C levels at the end of experimental periods. Data are mean ± SEM. *P < 0.05. Each group includes 5–7 mice.

Comment in

Similar articles

Cited by

References

    1. Baylis C, Corman B. The aging kidney: insights from experimental studies. J Am Soc Nephrol. 1998;9(4):699–709. - PubMed
    1. Coresh J, Astor BC, Greene T, Eknoyan G, Levey AS. Prevalence of chronic kidney disease and decreased kidney function in the adult US population: Third National Health and Nutrition Examination Survey. Am J Kidney Dis. 2003;41(1):1–12. - PubMed
    1. Epstein M. Aging and the kidney. J Am Soc Nephrol. 1996;7(8):1106–1122. - PubMed
    1. Cutler RG. Human longevity and aging: possible role of reactive oxygen species. Ann N Y Acad Sci. 1991;621:1–28. - PubMed
    1. Droge W. Free radicals in the physiological control of cell function. Physiol Rev. 2002;82(1):47–95. - PubMed

Publication types