. 2010 Jun 3;465(7298):627-31.
doi: 10.1038/nature08800. Epub 2010 Mar 24.

Genome-wide association study of 107 phenotypes in Arabidopsis thaliana inbred lines

Affiliations

Genome-wide association study of 107 phenotypes in Arabidopsis thaliana inbred lines

Susanna Atwell et al. Nature. .

Abstract

Although pioneered by human geneticists as a potential solution to the challenging problem of finding the genetic basis of common human diseases, genome-wide association (GWA) studies have, owing to advances in genotyping and sequencing technology, become an obvious general approach for studying the genetics of natural variation and traits of agricultural importance. They are particularly useful when inbred lines are available, because once these lines have been genotyped they can be phenotyped multiple times, making it possible (as well as extremely cost effective) to study many different traits in many different environments, while replicating the phenotypic measurements to reduce environmental noise. Here we demonstrate the power of this approach by carrying out a GWA study of 107 phenotypes in Arabidopsis thaliana, a widely distributed, predominantly self-fertilizing model plant known to harbour considerable genetic variation for many adaptively important traits. Our results are dramatically different from those of human GWA studies, in that we identify many common alleles of major effect, but they are also, in many cases, harder to interpret because confounding by complex genetics and population structure make it difficult to distinguish true associations from false. However, a-priori candidates are significantly over-represented among these associations as well, making many of them excellent candidates for follow-up experiments. Our study demonstrates the feasibility of GWA studies in A. thaliana and suggests that the approach will be appropriate for many other organisms.


Figures

Figure 1
Figure 1. The number of associations identified using different p-value thresholds for each phenotype
For each phenotype, the numbers of distinct peaks of association significant at nominal p-value thresholds of 10−4, 10−5,…, 10−9 are shown. The number of SNPs (out of 250,000) that would be expected to exceed each threshold is shown for comparison. a, No correction for population structure (non-parametric Wilcoxon Test). b, Correction for population structure (parametric mixed model [EMMA]).
Figure 2
Figure 2. GWA analysis of hypersensitive response to the bacterial elicitor AvrRpm1
a, Genome-wide p-values from Fisher’s Exact Test. The horizontal dashed line corresponds to a nominal 5% significance-threshold with Bonferroni-correction for 250,000 tests. b, Magnification of the genomic region surrounding RPM1, the position (and extent) of which is indicated by the vertical blue line.
Figure 3
Figure 3. Candidate SNPs are over-represented among strong associations
GWA analysis of the FT10 phenotype: negative log p-values from the Wilcoxon test are plotted against those from EMMA. Points corresponding to SNPs within 20 kb of a candidate gene are shown in red; the rest are shown in blue. The enrichment of the former over the latter in different parts of the distribution is shown.
Figure 4
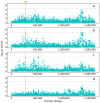
Figure 4. Association with FLC expression at the top of chromosome 4 near FRI
The p-values are from EMMA; the position of FRI is indicated by a vertical yellow line. a, Single-SNP tests. b, Col-allele of FRI (blue dot) is added as co-factor in the model. c, Ler-allele of FRI (red dot) is added as co-factor in the model. d, Both alleles added as co-factors in the model.

References

    1. Hirschhorn JN, Daly MJ. Genome-wide association studies for common diseases and complex traits. Nat Rev Genet. 2005;6:95–108. - PubMed
    1. Wellcome Trust Case-Control Consortium. Genome-wide association study of 14,000 cases of seven common diseases. 3,000 shared controls. Nature. 2007;447:661–678. - PMC - PubMed
    1. Koornneef M, Alonso-Blanco C, Vreugdenhil D. Naturally occurring genetic variation in Arabidopsis thaliana. Annu Rev Plant Biol. 2004;55:141–172. - PubMed
    1. Nordborg M, et al. The pattern of polymorphism in Arabidopsis thaliana. PLoS Biol. 2005;3:e196. - PMC - PubMed
    1. Shindo C, et al. Role of FRIGIDA and FLC in determining variation in flowering time of Arabidopsis thaliana. Plant Physiol. 2005;138:1163–1173. - PMC - PubMed

Publication types

Substances