Review
. 2010 Mar 25;464(7288):536-42.
doi: 10.1038/nature08984.

Biodemography of human ageing

Affiliations
Review

Biodemography of human ageing

James W Vaupel. Nature. .

Abstract

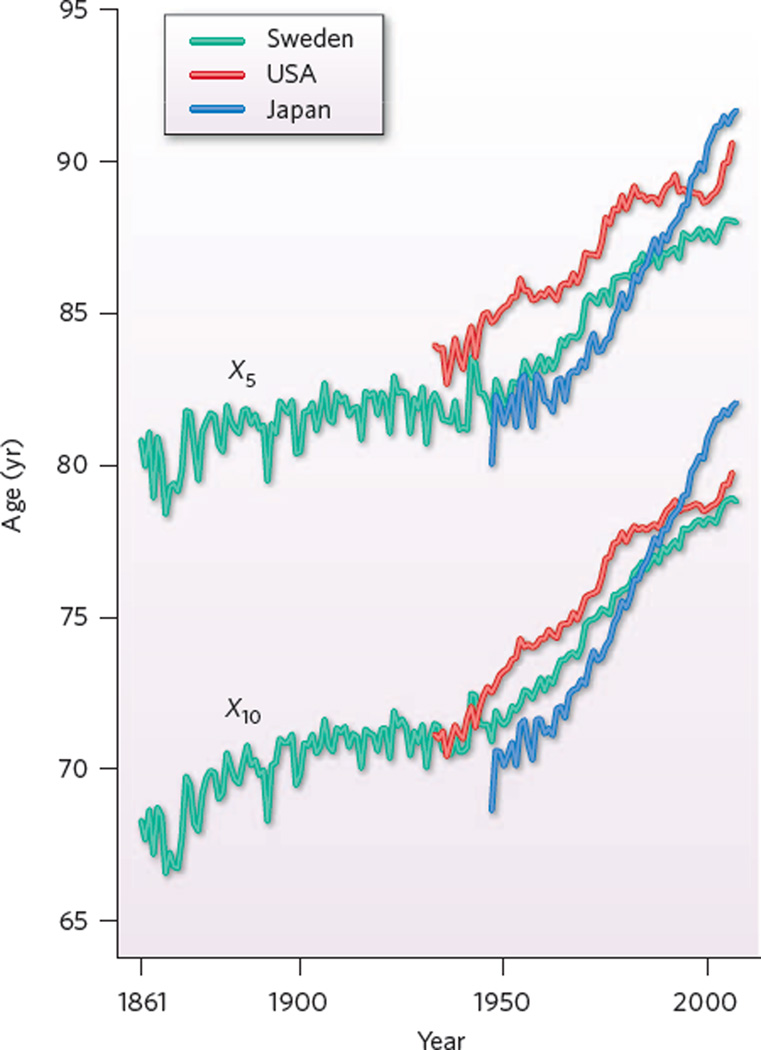
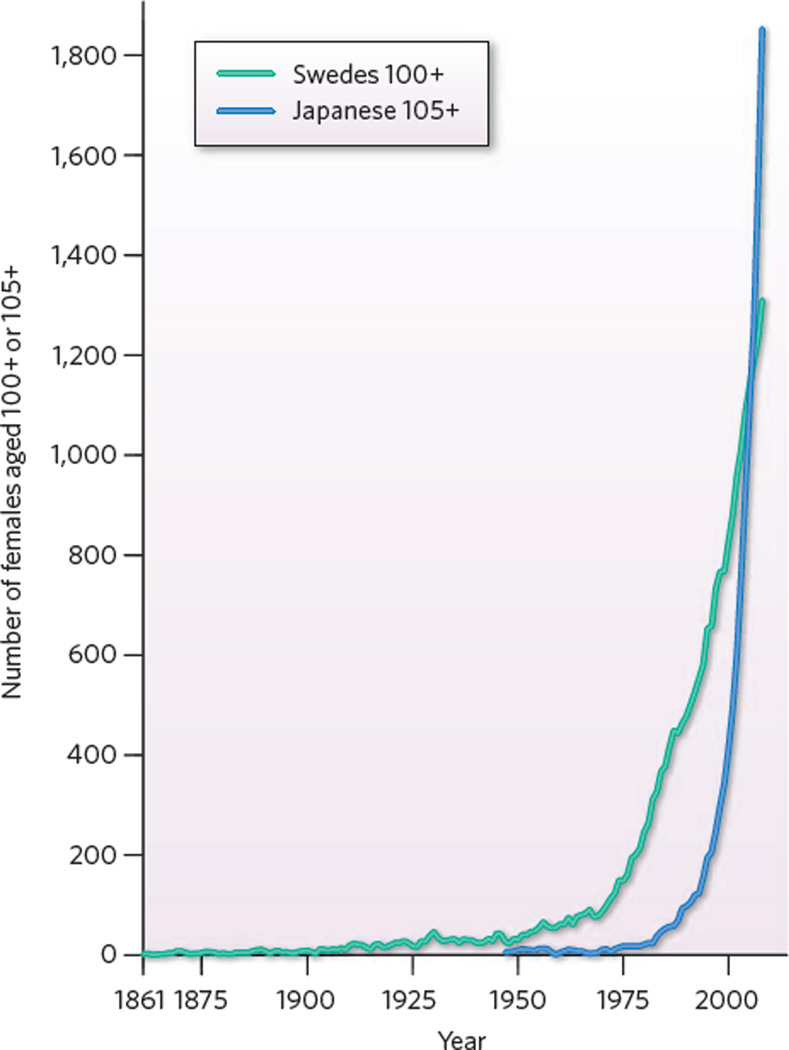
Human senescence has been delayed by a decade. This finding, documented in 1994 and bolstered since, is a fundamental discovery about the biology of human ageing, and one with profound implications for individuals, society and the economy. Remarkably, the rate of deterioration with age seems to be constant across individuals and over time: it seems that death is being delayed because people are reaching old age in better health. Research by demographers, epidemiologists and other biomedical researchers suggests that further progress is likely to be made in advancing the frontier of survival - and healthy survival - to even greater ages.


Figures

Figure 1
Figure 1. The postponement of mortality
Historical trends in X5 and X10, the ages at which remaining life expectancies are, respectively, five and ten years, for females in Sweden (1861–2008), the USA (1933–2006) and Japan (1947–2008). For Swedish women, since 1950 senescence as measured by X10 has been postponed by about eight years. For Japanese women, since 1950 X10 has risen by about 12 years. Note that for all three countries, the curve for X5 follows the same general trajectory as the curve for X10 but at a roughly constant gap of about a decade of age. This indicates that senescence, as captured by these two measures, is being postponed rather than lengthened. Both indicators show that progress in postponing senescence was slow for women in the USA between 1980 and 2000. The prospects are that more rapid progress can be expected in the future,: the rapid rise in X5 and X10 in recent years for US women may be a harbinger of this. (Data extended and updated from a graph in ref. 14 using information from the Human Mortality Database (http://www.mortality.org), from Statistics Sweden for Sweden 2008 and from the Japanese Ministry of Health for Japan 2008.)
Figure 2
Figure 2. The emergence of the extremely old
The numbers of females aged 100+ in Sweden from 1861 to 2008 and aged 105+ in Japan from 1947 to 2007. Very old people were rare until roughly half a century ago. Since then, the number of Swedish centenarians has risen rapidly, and since 1975 the number of Japanese women 105 or older has climbed almost vertically. (Data from the Kannisto–Thatcher Database on Old Age Mortality (http://www.demogr.mpg.de) supplemented with data from Statistics Sweden and the Japanese Ministry of Health.)
Figure 3
Figure 3. The population of Germany by age
The number of people in 2005 (red line) and 2025 (projected, blue line) by single year of age in Germany. Note that the projected population distribution in 2025 is similar to the distribution in 2005 but shifted 20 years to the right. The differences between the two distributions are mainly due to mortality; international immigration and emigration are relatively unimportant in Germany. The area coloured in red represents the loss of people younger than age 54 from 2005 to 2025; the area coloured in blue represents the gain of people older than 54. (Data from the Human Mortality Database (http://www.mortality.org) and the Coordinated Population Projection for Germany, German Statistical Office.)
Figure 4
Figure 4. Employment in Germany by age
Proportion of people by age working in Germany in 2005 (red line) and hypothetically in 2025 (black line), and hours worked per week per worker in 2005 (grey–green area) and hypothetically in 2025 (grey–blue area). Under the hypothetical scenario, at most ages a greater proportion of people would work, as shown by the difference between the black and red lines. At ages under 55, the employed in 2025 would work fewer hours per week on average than those in 2005: they would not contribute the work denoted by the green area. At ages between 60 and 70, the employed in 2025 would work more hours per week on average than those in 2005: they would contribute the additional work effort denoted by the blue area. In the hypothetical scenario, people aged from 20 to 65 work an average of about 25 hours per week: the 90% who work contribute about 28 hours of effort on average. If one-tenth of the population between ages 20 and 65 does not work at all, then another one-tenth could work 40 hours per week, four-tenths could work 30 hours per week and the remaining four-tenths could work 20 hours per week to maintain the work output at 2005 levels. (Calculations based on data from the EU Labour Force Survey.)

Comment in

Similar articles

Cited by

References

    1. Jeune B. Living longer—but better? Aging Clin. Exp. Res. 2002;14:72–92. This engaging account, with 238 references, summarizes ideas and theories about longevity from Genesis and the Sumerian legend of Gilgamesh to the present.

    1. Barnes J, editor. The Complete Works of Aristotle: The Revised Oxford Translation. Princeton Univ. Press; 1984. Aristotle; pp. 740–744.
    1. Hygiene: De Sanitate Tuenda. Ch. 2. Vol. 1. Thomas; 1951. Galen.
    1. Bacon R. In: The Code of Health and Longevity. Sinclair J, editor. Constable: 1806.
    1. Cornaro L. The Art of Living Long. Springer; 2005.

Publication types