. 2010 Apr 14;12(14):3542-9.
doi: 10.1039/b925033f. Epub 2010 Feb 11.

A natural missing link between activated and downhill protein folding scenarios

Affiliations

A natural missing link between activated and downhill protein folding scenarios

Feng Liu et al. Phys Chem Chem Phys. .

Abstract

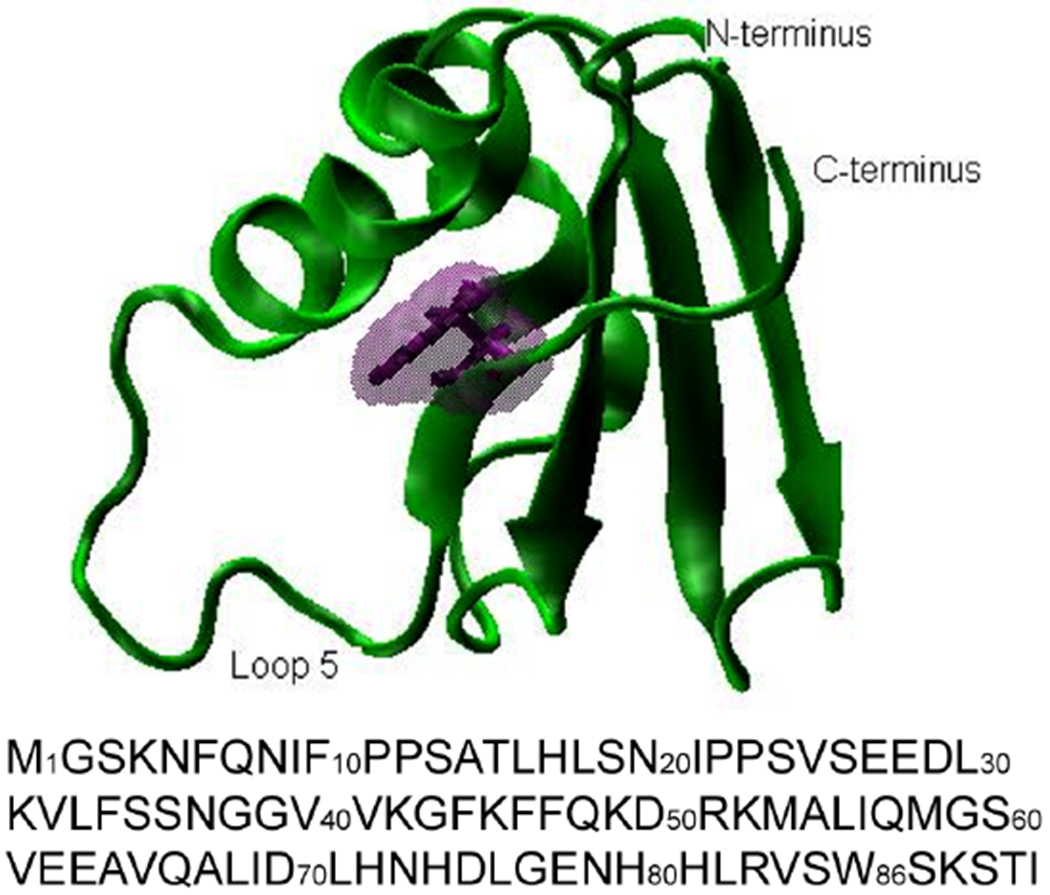
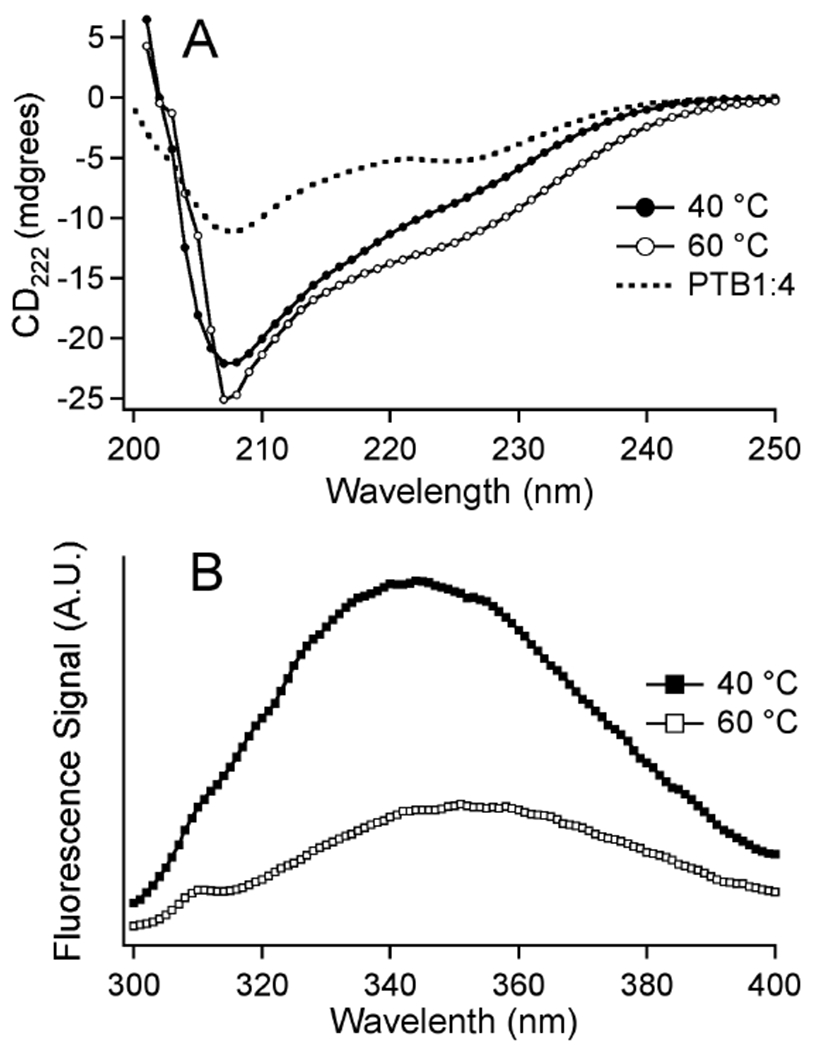
We propose protein PTB1 : 4W as a good candidate for engineering into a downhill folder. PTB1 : 4W has a probe-dependent thermal unfolding curve and sub-millisecond T-jump relaxation kinetics on more than one time scale. Its refolding rate in denaturant is a non-linear function of denaturant concentration (curved chevron plot). Yet at high denaturant concentration its unfolding is probe-independent, and the folding kinetics can be fitted to a single exponential decay. The domain appears to fold via a mechanism between downhill folding and activated folding over several small barriers, and when denaturant is added, one of these barriers greatly increases and simplifies the observed folding to apparent two-state kinetics. We predict the simplest free energy function consistent with the thermal denaturation and kinetics experiments by using the singular value Smoluchowski dynamics (SVSD) model. PTB1 : 4W is a natural 'missing link' between downhill and activated folding. We suggest mutations that could move the protein into the downhill folding limit.


Figures

Fig. 1
Fig. 1
Protein structure and sequence of PTB1:4. The protein structure plot was prepared with VMD. Phe86 shown in purple is replaced by Trp in PTB1:4W. Comparison of the 1H/15N HSQC NMR spectra (data not shown) of the two proteins show local chemical shift changes, but no indications of significant structural changes.
Fig. 2
Fig. 2
(A) Circular dichroism spectra of PTB1:4W (3 μM, pH 7) spanning the main thermal denaturation transition between 40 and 60 °C. The CD spectrum of the tryptophan-free PTB1:4 (dotted line, 20 °C) is different from PTB1:4W. (The 20 °C spectrum of PTB1:4W is 20% smaller but has the same shape as the 40 °C spectrum shown.) (B) Fluorescence spectra of PTB1:4W (2 μM, pH 7) spanning the main thermal denaturation transition between 40 and 60 °C.
Fig. 3
Fig. 3
Circular dichroism (open squares, 3 μM, pH 7) and fluorescence intensity (open triangles, 2 μM, pH 7) thermal titration curves of PTB1:4W were measured simultaneously and normalized to the 0 to 1 range for comparison. The fluorescence wavelength shift (open circles) was measured separately on a fluorimeter. No satisfactory global two-state fit was achieved (dashed lines). The SVSD model produced a satisfactory fit (solid lines).
Fig. 4
Fig. 4
Fluorescence intensity (circles) and wavelength shift (squares) upon guanidine hydrochloride denaturation of PTB1:4W. This data could be fitted by a global two-state model (dashed lines).
Fig. 5
Fig. 5
Folding relaxation kinetics of PTB1:4W by a temperature jump from 50 °C to 60 °C detected by normalized fluorescence lifetime change (see Methods). The solid black curve is the SVSD model fit from Smoluchowski dynamics. The top trace shows the residual of a direct double-exponential fit to τ1=18 μs and τ2=479 μs.
Fig. 6
Fig. 6
Stopped-flow experiments at low (0.27 M) and high (1.5 M) final guanidine hydrochloride concentration show slow single exponential refolding kinetics (dashed lines) with no burst phase. For reference, a 3 M to 3 M jump baseline is shown.
Fig. 7:
Fig. 7:
Summary of the kinetic data. The sub-ms phase upon T-jump is shown in open markers at the top with a temperature axis. The ms refolding kinetics from GuHCl stopped flow are shown in black circles at the bottom. The GuHCl Chevron is curved throughout, and the 23 °C stopped flow data do not extrapolate to the much faster T-jump data at 35 °C higher temperature.
Fig. 8
Fig. 8
(A) SVSD method. Left: the protein population distribution ρ is calculated at equilibrium or during kinetics on the free energy surface G(x); then S(x)ρ(x) is integrated to yield the signal S(T) or S(t). Right: A genetic algorithm selects the best members from a population of free energy syrfaces and generates the next generation to calculate signals for comparison with experiment. (B) SVSD free energy functions calculated at 50, 60 and 70 °C. Shown are the optimal functions fitted to the temperature jump and titration data in figures 4 and 6. The normalized signal functions are shown at the top.

Similar articles

Cited by

References

    1. Kubelka J; Hofrichter J; Eaton WA. Curr. Opinion. Struct. Bio, 2004, 14, 76–88. - PubMed
    1. Gruebele M. Comptes Rendus Biol, 2005, 328, 701–712. - PubMed
    1. Munoz V. Ann. Rev. Biophys. Biomol. Struct, 2007, 36, 395–412. - PubMed
    1. Zhang J; Li WF; Wang J; Qin M; Wang W. Proteins-Struct. Funct. Bioinformatics, 2008, 72, 1038–1047. - PubMed
    1. Freddolino PL; Liu F; Gruebele M; Schulten K. Biophys. J, 2008, 94, L75–L77. - PMC - PubMed

Publication types