. 2011 Jan;32(1):80-93.
doi: 10.1002/hbm.21000.

A phase synchrony measure for quantifying dynamic functional integration in the brain

Affiliations

A phase synchrony measure for quantifying dynamic functional integration in the brain

Selin Aviyente et al. Hum Brain Mapp. 2011 Jan.

Abstract

The temporal coordination of neural activity within structural networks of the brain has been posited as a basis for cognition. Changes in the frequency and similarity of oscillating electrical potentials emitted by neuronal populations may reflect the means by which networks of the brain carry out functions critical for adaptive behavior. A computation of the phase relationship between signals recorded from separable brain regions is a method for characterizing the temporal interactions of neuronal populations. Recently, different phase estimation methods for quantifying the time-varying and frequency-dependent nature of neural synchronization have been proposed. The most common method for measuring the synchronization of signals through phase computations uses complex wavelet transforms of neural signals to estimate their instantaneous phase difference and locking. In this article, we extend this idea by introducing a new time-varying phase synchrony measure based on Cohen's class of time-frequency distributions. This index offers improvements over existing synchrony measures by characterizing the similarity of signals from separable brain regions with uniformly high resolution across time and frequency. The proposed measure is applied to both synthesized signals and electroencephalography data to test its effectiveness in estimating phase changes and quantifying neural synchrony in the brain.


Figures

Figure 1
Figure 1
(a) Magnitude of Rihaczek distribution and (b) magnitude of RID‐Rihaczek distribution for the sum of two gabor logon signals, formula image 
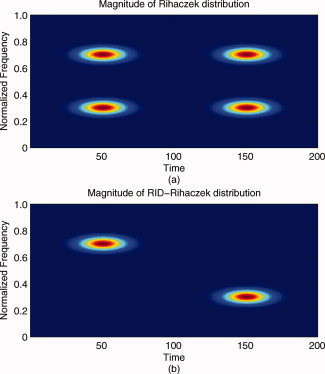
computed with a Choi‐Williams kernel, formula image, where σ = 0.001. [Color figure can be viewed in the online issue, which is available at wileyonlinelibrary.com.]
Figure 2
Figure 2
Statistical evaluation of the RID‐TFPS measure: (a) The bias and the range (minimum to maximum) of RID‐TFPS measure for 200 simulations of 200 white noise pairs as a function of the number of trials. (b) The significance threshold for the RID‐TFPS for P = 0.05 as a function of the number of trials. [Color figure can be viewed in the online issue, which is available at wileyonlinelibrary.com.]
Figure 3
Figure 3
Comparison of the theoretical and estimated time‐varying phase difference between x 1(t) = exp(jw 1 t) and x 2(t) = exp(jw 1(tat 2)), where ω1 = 8π, a = 0.25 for the time range 0–1 s using the proposed RID‐Rihaczek‐based phase estimation method: (a) The two signals and (b) the theoretical and the estimated phase differences. [Color figure can be viewed in the online issue, which is available at wileyonlinelibrary.com.]
Figure 4
Figure 4
Average phase locking value for two chirp signals with a constant phase difference in noise, that is, x 1(t) = exp(j0 t + βt 2)) and x 2(t) = exp(j0 t + βt 2 + θ)) over 100 simulations: (a) RID‐TFPS and (b) wavelet‐TFPS.
Figure 5
Figure 5
Comparison of robustness of the RID‐TFPS versus the wavelet‐TFPS in noise for a range of SNRs [−12 dB, 17 dB]. A total of 200 simulations with 200 trials are run for each SNR value and for the two types of signals (high synchrony pair and low synchrony pair). The mean and the range of synchrony values (minimum to maximum) over 200 simulations at 8 Hz are shown: (a) between two high synchrony signals (sinusoids in independent white Gaussian noise, x 1(t) = sin(16πt) + n 1(t), x 2(t) = sin(16πt + π/4) + n 2(t))) and (b) between two low synchrony signals (a sinusoid in white Gaussian noise and independent white Gaussian noise, x 1(t) = sin(16πt) + n 1(t), x 2(t) = n 2(t))). [Color figure can be viewed in the online issue, which is available at wileyonlinelibrary.com.]
Figure 6
Figure 6
Comparison of the RID‐TFPS and the wavelet‐TFPS for error and correct trials. The first row shows the grand average of the response for error and correct trials in the time domain. The second and third rows show the RID‐ and the wavelet‐TFPS measures, respectively. The left column contains data from error trials and the right from correct trials.
Figure 7
Figure 7
The spatial localization of the baseline corrected error–correct difference phase synchrony based on the RID‐TFPS. The average phase synchrony surfaces across subjects depicting variation of the error–correct difference phase locking values for a subset of electrodes are shown.
Figure 8
Figure 8
Comparison of the RID‐TFPS and the wavelet‐TFPS topographic maps for the error–correct difference in the ERN theta window. The right side of the plot depicts the statistical assessment of the differences using the Wilcoxon sign‐rank test.

References

    1. Ansari‐Asl K, Bellanger JJ, Bartolomei F, Wendling F, Senhadji L ( 2005): Time‐frequency characterization of interdependencies in nonstationary signals: Application to epileptic EEG. IEEE Trans Biomed Eng 52: 1218–1226. - PMC - PubMed
    1. Baccalá LA, Sameshima K ( 2001): Partial directed coherence: A new concept in neural structure determination. Biol Cybern 84: 463–474. - PubMed
    1. Breakspear M ( 2002): Nonlinear phase desynchronization in human electroencephalographic data. Hum Brain Mapp 15: 175–198. - PMC - PubMed
    1. Breakspear M, Terry JR ( 2002): Nonlinear interdependence in neural systems: Motivation, theory, and relevance. Int J Neurosci 112: 1263–1284. - PubMed
    1. Brown P ( 2003): Oscillatory nature of human basal ganglia activity: Relationship to the pathophysiology of Parkinson's disease. Mov Disord 18: 357–363. - PubMed