Abnormal sleep/wake dynamics in orexin knockout mice
- PMID: 20337187
- PMCID: PMC2831423
- DOI: 10.1093/sleep/33.3.297
Abnormal sleep/wake dynamics in orexin knockout mice
Abstract
Study objectives: Narcolepsy with cataplexy is caused by a loss of orexin (hypocretin) signaling, but the physiologic mechanisms that result in poor maintenance of wakefulness and fragmented sleep remain unknown. Conventional scoring of sleep cannot reveal much about the process of transitioning between states or the variations within states. We developed an EEG spectral analysis technique to determine whether the state instability in a mouse model of narcolepsy reflects abnormal sleep or wake states, faster movements between states, or abnormal transitions between states.
Design: We analyzed sleep recordings in orexin knockout (OXKO) mice and wild type (WT) littermates using a state space analysis technique. This non-categorical approach allows quantitative and unbiased examination of sleep/wake states and state transitions.
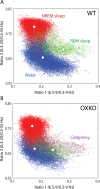
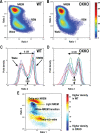
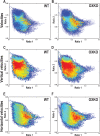
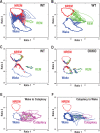
Measurements and results: OXKO mice spent less time in deep, delta-rich NREM sleep and in active, theta-rich wake and instead spent more time near the transition zones between states. In addition, while in the midst of what should be stable wake, OXKO mice initiated rapid changes into NREM sleep with high velocities normally seen only in transition regions. Consequently, state transitions were much more frequent and rapid even though the EEG progressions during state transitions were normal.
Conclusions: State space analysis enables visualization of the boundaries between sleep and wake and shows that narcoleptic mice have less distinct and more labile states of sleep and wakefulness. These observations provide new perspectives on the abnormal state dynamics resulting from disrupted orexin signaling and highlight the usefulness of state space analysis in understanding narcolepsy and other sleep disorders.
Figures


Similar articles
-
Behavioral state instability in orexin knock-out mice.J Neurosci. 2004 Jul 14;24(28):6291-300. doi: 10.1523/JNEUROSCI.0586-04.2004. J Neurosci. 2004. PMID: 15254084 Free PMC article.
-
Orexin gene therapy restores the timing and maintenance of wakefulness in narcoleptic mice.Sleep. 2013 Aug 1;36(8):1129-38. doi: 10.5665/sleep.2870. Sleep. 2013. PMID: 23904672 Free PMC article.
-
Specificity of direct transition from wake to REM sleep in orexin/ataxin-3 transgenic narcoleptic mice.Exp Neurol. 2009 May;217(1):46-54. doi: 10.1016/j.expneurol.2009.01.015. Epub 2009 Feb 3. Exp Neurol. 2009. PMID: 19416673 Free PMC article.
-
Orexin neuronal circuitry: role in the regulation of sleep and wakefulness.Front Neuroendocrinol. 2008 Jan;29(1):70-87. doi: 10.1016/j.yfrne.2007.08.001. Epub 2007 Aug 29. Front Neuroendocrinol. 2008. PMID: 17910982 Review.
-
Hypocretin and its emerging role as a target for treatment of sleep disorders.Curr Neurol Neurosci Rep. 2011 Apr;11(2):227-34. doi: 10.1007/s11910-010-0172-9. Curr Neurol Neurosci Rep. 2011. PMID: 21170610 Review.
Cited by
-
Orexin and Sleep Disturbances in Alpha-Synucleinopathies: a Systematic Review.Curr Neurol Neurosci Rep. 2024 Sep;24(9):389-412. doi: 10.1007/s11910-024-01359-6. Epub 2024 Jul 20. Curr Neurol Neurosci Rep. 2024. PMID: 39031323 Free PMC article.
-
Sleep/Wake Dynamics Changes during Maturation in Rats.PLoS One. 2015 Apr 20;10(4):e0125509. doi: 10.1371/journal.pone.0125509. eCollection 2015. PLoS One. 2015. PMID: 25894573 Free PMC article.
-
Technical advances in the characterization of the complexity of sleep and sleep disorders.Prog Neuropsychopharmacol Biol Psychiatry. 2013 Aug 1;45:277-86. doi: 10.1016/j.pnpbp.2012.09.017. Epub 2012 Nov 19. Prog Neuropsychopharmacol Biol Psychiatry. 2013. PMID: 23174482 Free PMC article. Review.
-
Unveiling the role of melatonin MT2 receptors in sleep, anxiety and other neuropsychiatric diseases: a novel target in psychopharmacology.J Psychiatry Neurosci. 2014 Jan;39(1):6-21. doi: 10.1503/jpn.130009. J Psychiatry Neurosci. 2014. PMID: 23971978 Free PMC article. Review.
-
Endogenous cholinergic input to the pontine REM sleep generator is not required for REM sleep to occur.J Neurosci. 2014 Oct 22;34(43):14198-209. doi: 10.1523/JNEUROSCI.0274-14.2014. J Neurosci. 2014. PMID: 25339734 Free PMC article.
References
-
- Broughton R, Valley V, Aguirre M, Roberts J, Suwalski W, Dunham W. Excessive daytime sleepiness and the pathophysiology of narcolepsy-cataplexy: a laboratory perspective. Sleep. 1986;9:205–15. - PubMed
-
- Lin L, Faraco J, Li R, et al. The sleep disorder canine narcolepsy is caused by a mutation in the hypocretin (orexin) receptor 2 gene. Cell. 1999;98:365–76. - PubMed
-
- Taheri S, Zeitzer JM, Mignot E. The role of hypocretins (orexins) in sleep regulation and narcolepsy. Annu Rev Neurosci. 2002;25:283–313. - PubMed
Publication types
MeSH terms
Substances
Grants and funding
LinkOut - more resources
Full Text Sources

