EEG sleep spectra in older adults across all circadian phases during NREM sleep
- PMID: 20337198
- PMCID: PMC2831434
- DOI: 10.1093/sleep/33.3.389
EEG sleep spectra in older adults across all circadian phases during NREM sleep
Abstract
Study objectives: Healthy aging is associated with changes in sleep-wake regulation, and those changes often lead to problems sleeping, both during the night and during daytime. We aimed to examine the electroencephalographic (EEG) sleep spectra during non-rapid eye movement (NREM) sleep when sleep was scheduled at all times of day.
Design/interventions: After three 24-h baseline (BL) days, participants were scheduled to live on 20-hour "days" consisting of 6.7 hours of bed rest and 13.3 hours of wakefulness for 12 consecutive days (forced desynchrony, FD). The EEG was recorded from a central derivation during all scheduled sleep episodes, with subsequent visual scoring and spectral analysis.
Setting: Intensive Physiological Monitoring Unit of the Brigham & Women's Hospital General Clinical Research Center.
Participants: Twenty-four healthy older subjects (64.2 +/- 6.3 yr; 13 women, 11 men)
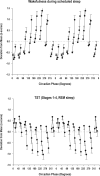
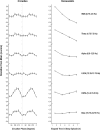
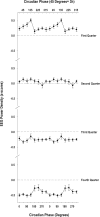
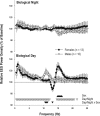
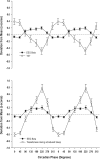
Measurements and results: Compared with BL nights, EEG activity in the slow wave (0.5 to 5.25 Hz), theta (6 to 6.25 and 7 Hz), alpha (10 to 11.25 Hz), and high spindle range (14.5 to 15.5 Hz) was significantly greater during FD, when subjects slept across many times of day and night. During FD, there was a significant interaction between homeostatic and circadian factors, such that EEG delta activity (0.5 to 1.5 Hz) was higher in the biological morning/early afternoon than at other times. EEG activity was significantly increased in almost all frequency ranges (0.5 to 21 Hz) during the biological day, as compared with the biological night, except for the lower EEG spindle range (12.25 to 14 Hz). Overall, EEG beta activity was positively correlated with wakefulness and negatively correlated with total sleep time.
Conclusion: Our findings provide some new evidence for the underlying mechanisms that contribute to age-related difficulties in sleep consolidation, especially when sleep occurs during the daytime.
Figures



Similar articles
-
Circadian and homeostatic modulation of sleep in older adults during a 90-minute day study.Sleep. 2004 Dec 15;27(8):1535-41. doi: 10.1093/sleep/27.8.1535. Sleep. 2004. PMID: 15683145 Clinical Trial.
-
Young women with major depression live on higher homeostatic sleep pressure than healthy controls.Chronobiol Int. 2012 Apr;29(3):278-94. doi: 10.3109/07420528.2012.656163. Chronobiol Int. 2012. PMID: 22390241
-
Electroencephalographic sleep inertia of the awakening brain.Neuroscience. 2011 Mar 10;176:308-17. doi: 10.1016/j.neuroscience.2010.12.014. Epub 2010 Dec 15. Neuroscience. 2011. PMID: 21167917
-
Age-related changes in the circadian and homeostatic regulation of human sleep.Chronobiol Int. 2006;23(1-2):461-74. doi: 10.1080/07420520500545813. Chronobiol Int. 2006. PMID: 16687319 Review.
-
Contribution of circadian physiology and sleep homeostasis to age-related changes in human sleep.Chronobiol Int. 2000 May;17(3):285-311. doi: 10.1081/cbi-100101049. Chronobiol Int. 2000. PMID: 10841208 Review.
Cited by
-
Associations of Baseline Sleep Microarchitecture with Cognitive Function After 8 Years in Middle-Aged and Older Men from a Community-Based Cohort Study.Nat Sci Sleep. 2023 May 24;15:389-406. doi: 10.2147/NSS.S401655. eCollection 2023. Nat Sci Sleep. 2023. PMID: 37252206 Free PMC article.
-
Sleep and circadian rhythmicity as entangled processes serving homeostasis.Nat Rev Neurosci. 2024 Jan;25(1):43-59. doi: 10.1038/s41583-023-00764-z. Epub 2023 Dec 1. Nat Rev Neurosci. 2024. PMID: 38040815 Review.
-
Ageing-related changes in nap neuroscillatory activity are mediated and moderated by grey matter volume.Eur J Neurosci. 2021 Nov;54(9):7332-7354. doi: 10.1111/ejn.15468. Epub 2021 Oct 5. Eur J Neurosci. 2021. PMID: 34541728 Free PMC article.
-
Modulation of the brain's functional network architecture in the transition from wake to sleep.Prog Brain Res. 2011;193:277-94. doi: 10.1016/B978-0-444-53839-0.00018-1. Prog Brain Res. 2011. PMID: 21854969 Free PMC article.
-
A Recurrent Increase of Synchronization in the EEG Continues from Waking throughout NREM and REM Sleep.ISRN Neurosci. 2014 Feb 6;2014:756952. doi: 10.1155/2014/756952. eCollection 2014. ISRN Neurosci. 2014. PMID: 24967318 Free PMC article.
References
-
- Bliwise DL. Normal aging. In: Kryger MH, Roth T, Dement WC, editors. Principles and Practices of Sleep Medicine. Philadelphia, PA: WB Saunders; 1994. pp. 26–39.
-
- Bonnet MH, Arand DL. Sleep loss in aging. Clin Geriatr Med. 1989;5:405–20. - PubMed
-
- Landolt H-P, Dijk DJ, Achermann P, Borbéely AA. Effect of age on the sleep EEG: Slow-wave activity and spindle frequency activity in young and middle-aged men. Brain Res. 1996;738:205–12. - PubMed
-
- Feinberg I, Campbell IG. Kinetics of non-rapid eye movement delta production across sleep and waking in young and elderly normal subjects: theoretical implications. Sleep. 2003;26:192–200. - PubMed
-
- Gaudreau H, Carrier J, Montplaisir J. Age-related modifications of NREM sleep EEG: from childhood to middle age. J Sleep Res. 2001;10:165–72. - PubMed
Publication types
MeSH terms
Grants and funding
LinkOut - more resources
Full Text Sources
Medical

