. 2010 Mar 26:11:202.
doi: 10.1186/1471-2164-11-202.

Metabolic modeling and analysis of the metabolic switch in Streptomyces coelicolor

Collaborators, Affiliations

Metabolic modeling and analysis of the metabolic switch in Streptomyces coelicolor

Mohammad T Alam et al. BMC Genomics. .

Abstract

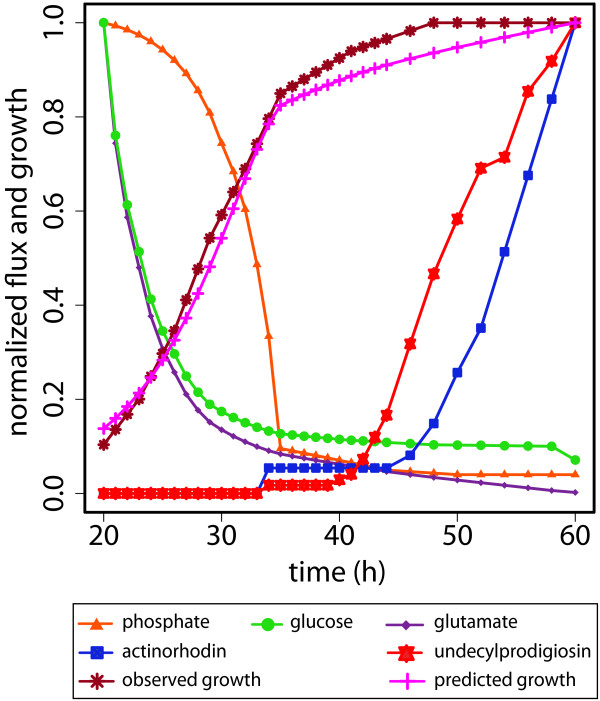
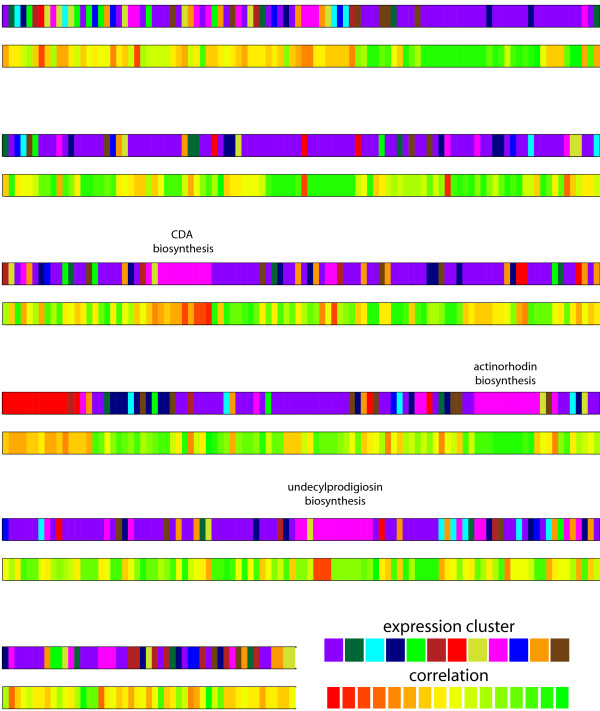
Background: The transition from exponential to stationary phase in Streptomyces coelicolor is accompanied by a major metabolic switch and results in a strong activation of secondary metabolism. Here we have explored the underlying reorganization of the metabolome by combining computational predictions based on constraint-based modeling and detailed transcriptomics time course observations.

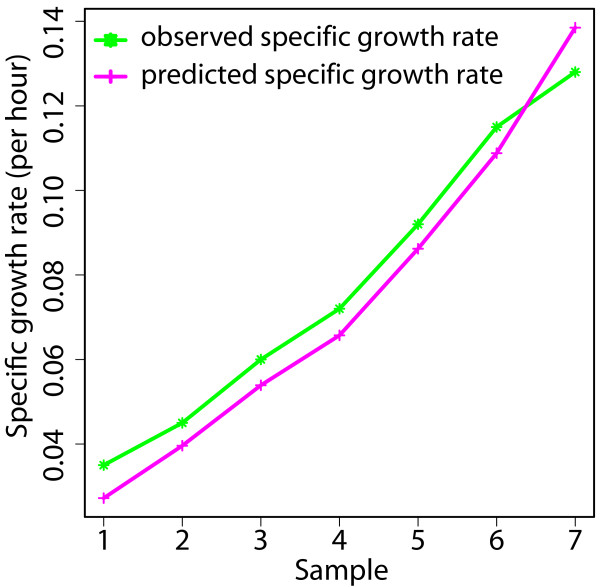
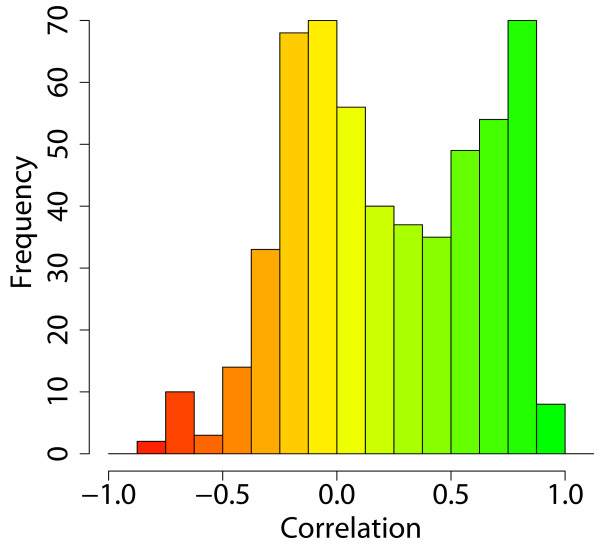
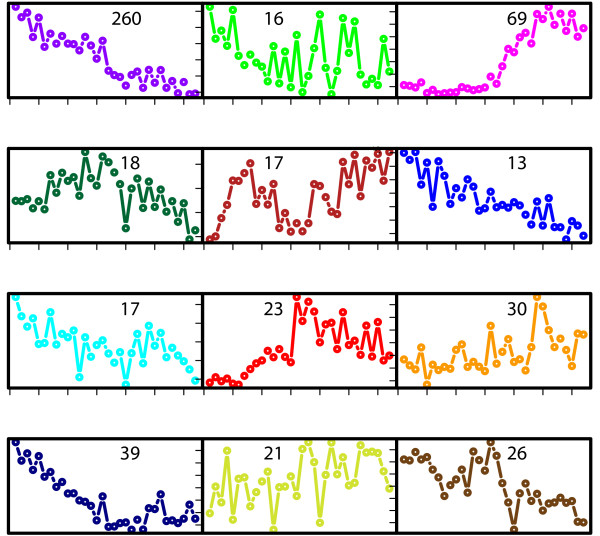
Results: We reconstructed the stoichiometric matrix of S. coelicolor, including the major antibiotic biosynthesis pathways, and performed flux balance analysis to predict flux changes that occur when the cell switches from biomass to antibiotic production. We defined the model input based on observed fermenter culture data and used a dynamically varying objective function to represent the metabolic switch. The predicted fluxes of many genes show highly significant correlation to the time series of the corresponding gene expression data. Individual mispredictions identify novel links between antibiotic production and primary metabolism.

Conclusion: Our results show the usefulness of constraint-based modeling for providing a detailed interpretation of time course gene expression data.


Figures

Figure 1
Figure 1
Model validation. Comparison of the experimentally observed specific growth rate from chemostat data [14] and the predicted in silico specific growth rate from the model in glucose limited media. The specific rate of glucose consumption, oxygen consumption, carbon dioxide production and actinorhodin production from 7 different conditions were taken from [14] and used as initial condition in the model.
Figure 2
Figure 2
Dynamic model constraints and predicted cell growth. Based on online measurement on a fermenter experiment, normalized constraints of model influx of phosphate, glucose, and glutamate and the production of the antibiotics actinorhodin and undecylprodigiosin were determined. Their time course is shown together with the experimentally observed and in silico predicted growth.
Figure 3
Figure 3
Correlation between predicted flux and observed gene expression. The histogram shows the correlation between gene expression and predicted flux for 549 enzyme-coding genes. A large number of enzyme-coding genes show high correlation. They include many primary metabolism genes and antibiotic biosynthesis genes. About half of the genes show poor correlation; these are mostly genes that show constant gene expression and/or predicted flux across the entire time course, leading to a correlation coefficient close to zero. A small but noteworthy number of genes show statistically significant negative correlation between gene expression levels and predicted flux. These cases are discussed in more detail in the main text.
Figure 4
Figure 4
Average expression profile of 12 expression clusters defined by hierarchical clustering. Gene expression profiles of all enzyme-coding genes in our metabolic flux model were subjected in unsupervised clustering. The number of genes in each cluster is indicated. Several clusters show a clear expression trend matching the changing physiology of the fermentation. The pink cluster is the "antibiotics" cluster, switching on upon phosphate depletion; the purple cluster includes the majority of central metabolism genes that are down-regulated.
Figure 5
Figure 5
Genome mapping of expression clusters and correlation between expression and predicted flux. All enzyme-coding genes are shown arranged in their order along the chromosome. The upper trace colors genes according to their membership in one of 12 expression clusters (Figure 4); genes belonging to the same cluster tend to be neighbors along the chromosome, reflecting the operon structure of the genome. The lower trace shows how strongly the predicted flux for each gene correlates with its expression. Genes from some expression clusters tend to show good correlation to the predicted flux (green), e.g. those in the central metabolism cluster (purple); mispredictions (red) seem to cluster along the chromosome and normally affect genes that are upregulated in stationary phase (pink cluster). The position of three major antibiotics biosynthesis clusters is highlighted.

References

    1. Kolter R, Siegele DA, Tormo A. The stationary phase of the bacterial life cycle. Annu Rev Microbiol. 1993;47:855–874. doi: 10.1146/annurev.mi.47.100193.004231. - DOI - PubMed
    1. Roszak DB, Colwell RR. Survival strategies of bacteria in the natural environment. Microbiol Rev. 1987;51(3):365–379. - PMC - PubMed
    1. Bentley SD, Chater KF, Cerdeno-Tarraga AM, Challis GL, Thomson NR, James KD, Harris DE, Quail MA, Kieser H, Harper D. et al.Complete genome sequence of the model actinomycete Streptomyces coelicolor A3(2) Nature. 2002;417(6885):141–147. doi: 10.1038/417141a. - DOI - PubMed
    1. Challis GL, Hopwood DA. Synergy and contingency as driving forces for the evolution of multiple secondary metabolite production by Streptomyces species. Proc Natl Acad Sci USA. 2003;100(Suppl 2):14555–14561. doi: 10.1073/pnas.1934677100. - DOI - PMC - PubMed
    1. Borodina I, Siebring J, Zhang J, Smith CP, van Keulen G, Dijkhuizen L, Nielsen J. Antibiotic overproduction in Streptomyces coelicolor A3 2 mediated by phosphofructokinase deletion. J Biol Chem. 2008;283(37):25186–25199. doi: 10.1074/jbc.M803105200. - DOI - PubMed

Publication types

MeSH terms