. 2010 Jun 17;115(24):5041-52.
doi: 10.1182/blood-2009-03-213363. Epub 2010 Mar 25.

Toll-like receptor 9 signaling by CpG-B oligodeoxynucleotides induces an apoptotic pathway in human chronic lymphocytic leukemia B cells

Affiliations

Toll-like receptor 9 signaling by CpG-B oligodeoxynucleotides induces an apoptotic pathway in human chronic lymphocytic leukemia B cells

Xueqing Liang et al. Blood. .

Abstract

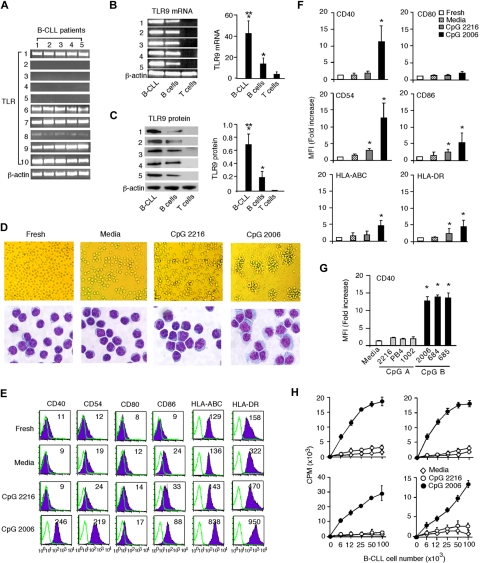
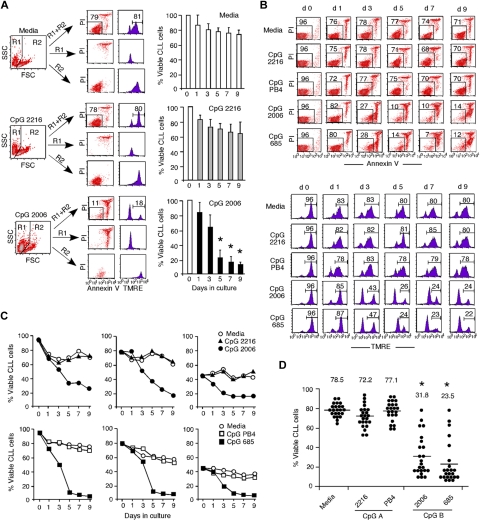
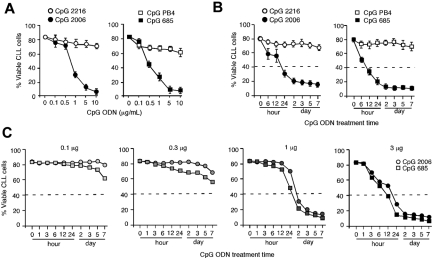
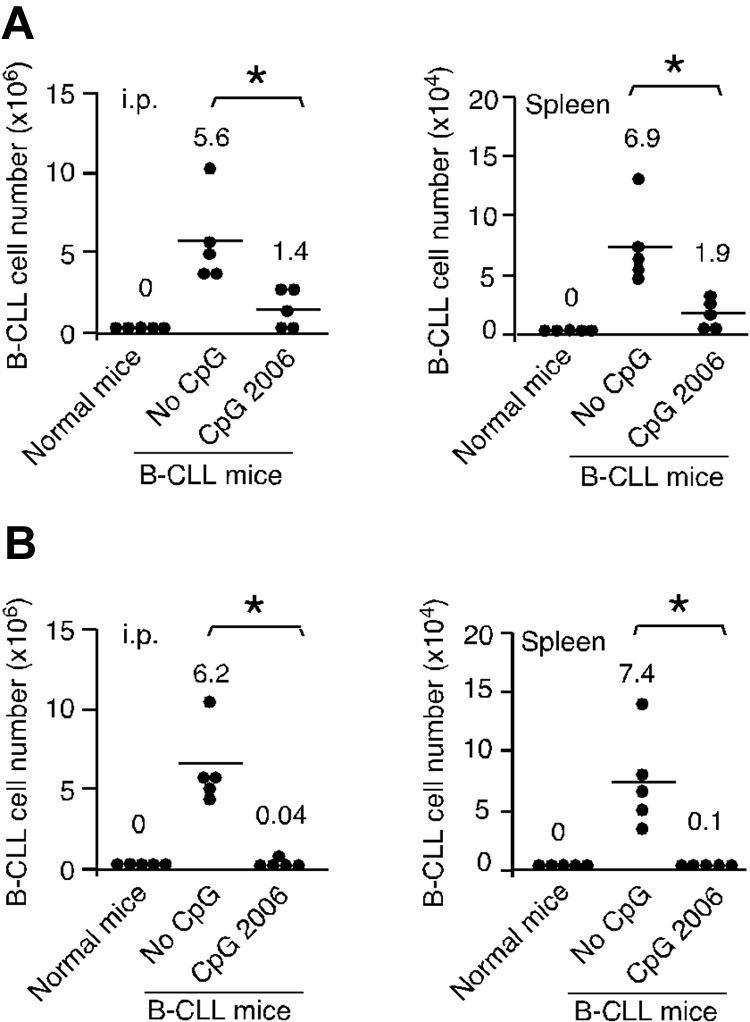
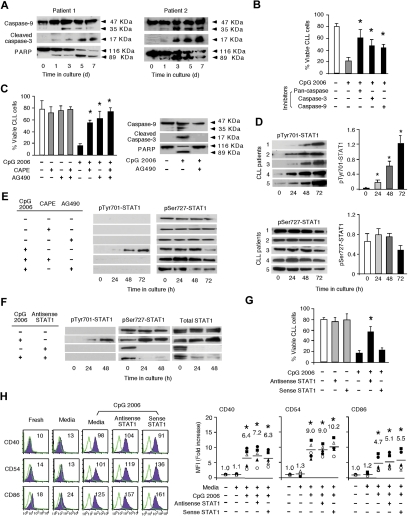
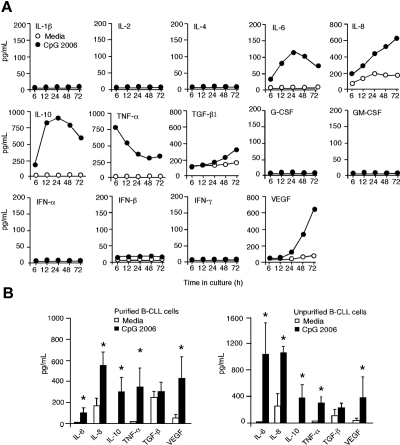
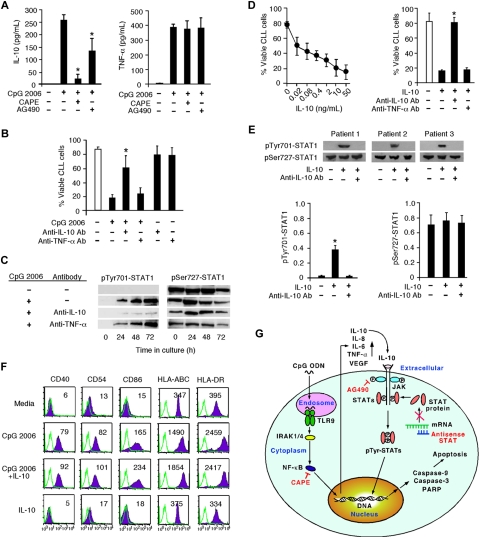
Chronic lymphocytic leukemia (CLL) is the most prevalent human leukemia and is characterized by the progressive accumulation of long-lived malignant B cells. Here we show that human B-CLL cells selectively express high levels of Toll-like receptor 9 (TLR9) mRNA and proteins. Treating B-CLL cells with TLR9 agonists, type B CpG oligodeoxynucleotides (CpG-B ODNs), induces significant morphologic and phenotypic activation, altered cytokine production, reversal of signal transducer, and activator of transcription 1 (STAT1) phosphorylation state, followed by profound apoptosis of B-CLL cells that is CpG-B ODN treatment time- and dose-dependent. TLR9-CpG ODN ligation-induced apoptosis of B-CLL cells is confirmed by viable cell counts, annexin V/propidium iodide and tetramethyl-rhodamine ethylester staining, Western blots of the activation, and cleaved caspases and poly (ADP-ribose) polymerase. Triggering TLR9 by CpG-B ODN leads to nuclear factor-kappaB-dependent production of autocrine interleukin-10, which activates JAK/STAT pathway-dependent tyrosine phosphorylation of STAT1 proteins and thereby provokes an apoptosis pathway in B-CLL cells. Treating B-CLL cells in vitro or in vivo with CpG-B ODN reduces the number of leukemia cells that engraft in NOD-scid mice. These findings provide new understanding of CpG ODN-mediated antitumor effects and support for the development of TLR9-targeted therapy for human CLL.


Figures

Figure 1
Figure 1
Human B-CLL cells express high levels of TLR9 and can be potently activated by CpG-B ODNs. Purified B-CLL cells from CLL patients 1 to 5 in Table 1 were used and tested. (A) RT-PCR results of TLR1-10 expression profile in B-CLL cells from 5 CLL patients. (B) RT-PCR results of TLR9 mRNA expression and (C) Western blot results of TLR9 protein expression in B-CLL cells from 5 patients were compared with that of normal B and T cells from 5 healthy blood donors, and normalized to the expression of β-actin. Data are presented as the mean ± SD in the adjacent bar diagram. *P < .01, B-CLL cells and B cells versus T cells. **P < .01, B-CLL cells versus B cells. (D) Morphologies of fresh and day 3 cultured B-CLL cells with or without CpG-A or CpG-B ODN were examined. Images of B-CLL cells in cultures were acquired on an Olympus CKX41 inverted microscope with an Olympus DP12 digital microscope camera at 200× magnification. Images of Giemsa staining of B-CLL cells were acquired on a Zeiss Axioplan 2 Upright Microscope (Carl Zeiss Inc) with a Spot RT color digital camera (Diagnostic Instruments), captured with a Zeiss Plan-Apochromat 63×/1.4 oil objective lens at 630× magnification, and processed with Spot advanced 4.6 software. (E) Expression of surface markers (shaded histogram) on fresh or day 3 cultured B-CLL cells with or without CpG-A or CpG-B ODN was analyzed by flow cytometry, indicated with MFI number, and overlaid with isotype control (unshaded histogram). Data are representative results from 1 of 5 CLL patients. (F) MFI fold increases of the indicated surface molecules on day 3 cultured versus uncultured B-CLL cells. Data are the mean ± SD from 5 independent experiments. *P < .01. (G) MFI fold increases of CD40 expression on day 3 cultured B-CLL cells with CpG-A or CpG-B ODNs versus B-CLL cells cultured in media only. Data are the mean ± SD from 5 independent experiments. *P < .01. (H) Graded doses of irradiated day 3 cultured B-CLL cells with or without CpG ODNs were used as stimulators to allogeneic T cells in MLR assays. Data are representative results with B-CLL cells from 4 CLL patients. The error bars represent the SD of triplicates. The independent experiments were performed with B-CLL cells derived from different CLL patients
Figure 2
Figure 2
TLR9 signaling by CpG-B ODN induces apoptotic death of B-CLL cells. (A) B-CLL cells were cultured in media with or without CpG 2216 or CpG 2006 for 9 days. Annexin V/PI-positive, TMRE-negative apoptotic (R1 gate) and annexin V/PI-negative, TMRE-positive viable (R2 gate) B-CLL cells in cultures were determined at the indicated time points. Flow cytometry data shown are representative for day 7 culture with indicated number (%) of viable B-CLL cells. Kinetic changes of viable B-CLL cell number in cultures are summarized in the adjacent bar graph. Data are the mean ± SD from 5 independent experiments with B-CLL cells from different CLL patients. *P < .01, viable B-CLL cells in media with versus without CpG ODN at each time point. (B[b]) B-CLL cells were cultured in media with or without the indicated CpG ODNs. Kinetic changes of annexin V/PI-negative, TMRE-positive B-CLL cells in cultures were determined. Data are representative results from 1 of 5 independent experiments with B-CLL cells from different CLL patients. The number (%) of viable B-CLL cells is indicated. (C) Representative results showing the addition of CpG-B ODNs to unpurified patient PBMCs containing different percentages (96%, 79%, or 45%) of B-CLL cells. (D) Data are results of day 5 cultures from independent experiments with purified B-CLL cells from the 23 CLL patients listed in Table 1. Each dot represents an individual patient, and the horizontal bar represents the median level. *P < .01, B-CLL cell numbers in cultures with versus without CpG ODNs. Annexin V/PI staining and TMRE staining were concurrently performed to determine the number of viable B-CLL cells in cultures with B-CLL cells from 10 CLL patients, and the results were comparable (data not shown).
Figure 3
Figure 3
CpG-B ODN-induced apoptosis in B-CLL cells is treatment time- and dose-dependent. (A) B-CLL cells were cultured with various doses of the CpG ODNs for 5 days. Data are the mean ± SD from 3 independent experiments with B-CLL cells from different CLL patients. (B) B-CLL cells were exposed to the indicated CpG ODNs (3 μg/mL) for different time lengths, washed, and cultured in media for a total of 7 days. Data are the mean ± SD from 3 independent experiments with B-CLL cells from different CLL patients. (C) B-CLL cells were exposed to different doses of CpG-B ODNs for different time lengths, washed, and cultured in media for a total of 7 days. Data are representative results from 1 of 2 experiments. The dashed lines indicate the required treatment time and/or dose of CpG ODN to reach the 50% decrease of B-CLL cells.
Figure 4
Figure 4
CpG ODN treatment reduces B-CLL cell engrafted in NOD-scid mouse xenograft models. (A) B-CLL cells with or without CpG 2006 pretreatment for 2 days were intraperitoneally injected into NOD-scid mice. After 5 days, B-CLL cells engrafted within the peritoneal cavity and spleen of NOD-scid mice were harvested and determined. (B) NOD-scid mice were intraperitoneally injected with fresh B-CLL cells followed by 5 daily intraperitoneal injections of CpG 2006 or PBS. After 5 days, the number of B-CLL cells within host peritoneal cavity and spleen were harvested and determined. (A-B) Results from 5 mice per group with B-CLL cells derived from different patients. Each dot represents an individual mouse, and the horizontal bar represents the median level. *P < .01, the number of B-CLL cells in mice with versus without CpG 2006 treatments. Naive NOD-scid mice were used as control.
Figure 5
Figure 5
CpG ODN-induced apoptosis of B-CLL cells depends on NF-κB and JAK/STAT signaling pathways and tyrosine phosphorylation of STAT1. (A) Cleavage of caspase-9, caspase-3, and PARP in B-CLL cells cultured with CpG 2006 were determined by Western blots at the indicated time points. Data are representative results from 2 of 3 independent experiments with B-CLL cells from different CLL patients. (B) B-CLL cells were cultured with or without CpG 2006 for 5 days in the presence or absence of pan-caspase, caspase-3, or caspase-9 inhibitor. Data are the mean ± SD from 3 independent experiments. *P < .01, B-CLL cell numbers versus CpG 2006 only group. (C) B-CLL cells with or without CAPE and/or AG490 pretreatment were cultured in media with or without CpG 2006 for 5 days. *P < .01, the number of viable B-CLL cells in CAPE and/or AG490 pretreated group versus B-CLL cells cultured with CpG 2006 only. Data are the mean ± SD from 5 independent experiments. Western blots of AG490 pretreatment on CpG 2006-induced activation and cleavage of caspase-9, caspase-3, and PARP in B-CLL cells at day 5 cultures. (D[b]) Western blot time course of CpG 2006-induced tyrosine- or serine-phosphorylated forms of STAT1 expression in B-CLL cells from 5 patients. Data are densitometrically assessed and presented as the mean ± SD in the adjacent bar diagram on the right. *P < .01, STAT1 expression in B-CLL cells before versus at each time point after CpG 2006 stimulation. (E) Western blots of tyrosine- or serine-phosphorylated forms of STAT1 expression in B-CLL cells with or without CAPE or AG490 pretreatment and cultured in media with or without CpG 2006 stimulation were determined at the indicated time points. Data are representative results of 3 independent experiments. (F) Western blots of STAT1 antisense ODN on total, tyrosine-, or serine-phosphorylated forms of STAT1 expression in B-CLL cells cultured with or without CpG 2006 for 2 days. Data are representative results of 3 independent experiments. (G) B-CLL cells with or without STAT1 antisense ODN or STAT1 sense ODN pretreatment were cultured in the presence or absence of CpG 2006 for 5 days. *P < .01, the number of viable B-CLL cells in STAT1 antisense ODN or STAT1 sense ODN pretreated group versus B-CLL cells cultured with CpG 2006 only. Data are the mean ± SD from 3 independent experiments. (H) B-CLL cells with or without STAT1 antisense ODN or STAT1 sense ODN pretreatment were cultured with CpG 2006 for 3 days. Expression of surface markers (shaded histogram) on fresh or cultured B-CLL cells was analyzed by flow cytometry, indicated with MFI number, and overlaid with isotype control (unshaded histogram). Data are representative results from 1 of 5 independent experiments. The adjacent diagrams on the right are MFI fold increases of the indicated surface molecules on day 3 cultured versus uncultured B-CLL cells from 5 CLL patients. *P < .01. The horizontal bar represents the median level with the indicated fold increase number.
Figure 6
Figure 6
TLR9 signaling by CpG ODN induces autocrine cytokine production by B-CLL cells. (A) Kinetics of cytokine production by purified B-CLL cells in cultures with or without CpG 2006 at the indicated time points (hours). The data shown are representative results from 1 of 3 experiments with CLL cells from different patients. (B) Aggregated results (n = 5, mean ± SD) of cytokine production by purified B-CLL cells or unpurified PBMCs containing more than 70% of B-CLL cells from patients 1 to 5 in cultures with or without CpG 2006 for 72 hours. *P < .01, each cytokine production by B-CLL cells in cultures with versus without CpG 2006.
Figure 7
Figure 7
CpG ODN uses autocrine IL-10 to provoke STAT1 tyrosine phosphorylation and apoptosis in B-CLL cells. (A) IL-10 and TNF-α production at 72 hours by CpG 2006-stimulated B-CLL cells with or without CAPE or AG490 pretreatment. Data are the mean ± SD from 5 independent experiments. *P < .01, IL-10 production by CpG 2006-stimulated B-CLL cells with versus without CAPE or AG 490 pretreatments. (B) Viable B-CLL cell number in day 5 cultures with or without CpG 2006 and in the presence or absence of anti–IL-10 or anti–TNF-α Abs. Data are the mean ± SD from 5 independent experiments. *P < .01, the viable B-CLL cell number of anti–IL-10 Ab group versus the CpG 2006 only group. (C) Western blot time course of tyrosine-phosphorylated or serine-phosphorylated STAT1 expression in CpG 2006-stimulated B-CLL cells in the presence or absence of anti–IL-10 or anti–TNF-α Abs. The data shown are representative results from 1 of 2 experiments. (D) Dose effect of IL-10 on B-CLL cell apoptosis in culture at day 5. Data are the mean ± SD from 7 independent experiments with B-CLL cells from 7 individual CLL patients (left panel). The number (%) of viable B-CLL cells in IL-10 (5 ng/mL) cultures with or without anti–IL-10 or anti–TNF-α Abs was determined at day 5. Data are the mean ± SD from 5 independent experiments with B-CLL cells from different CLL patients (right panel). *P < .01, B-CLL cell numbers in IL-10 cultures with versus anti–IL-10 or anti–TNF-α Abs. (E) Western blot of tyrosine-phosphorylated or serine-phosphorylated STAT1 expression in B-CLL cells cultured with or without IL-10 in the presence or absence of anti–IL-10 Abs was determined at 24 hours of culture. The data shown are representative results from 3 of 5 independent experiments. Data from the 5 CLL patients are densitometrically assessed and presented as the mean ± SD in the adjacent bar diagrams. *P < .01, STAT1 expression in B-CLL cells in IL-10 cultures with versus without anti–IL-10 Abs to the media only group. (F) Expression of the indicated surface markers on B-CLL cells cultured with or without CpG 2006 and/or IL-10 was analyzed at day 3, indicated with MFI number, and overlaid with isotype control. Data are representative results from 1 of 3 independent experiments with B-CLL cells derived from different CLL patients. (G) Schematic representation of TLR9-CpG ODN ligation induced apoptotic pathway in B-CLL cells. CpG ODN is recognized by TLR9 and ligated with it in the endosome engaging an intracellular pathway and leading to NF-κB activation and translocation. Binding of activated NF-κB fragments to DNA induces the production of cytokines (eg, IL-10, TNF-α). Extracellular binding of IL-10 with its receptor activates JAK/STAT pathway-dependent tyrosine phosphorylation of STAT proteins, leading to the activation and cleavage of caspase-9, caspase-3, and PARP, and consequent apoptosis of B-CLL cells. CAPE specifically inhibits NF-κB activation. AG490 blocks JAK phosphorylation, thus blocking the JAK/STAT signaling pathway. STAT1 antisense ODN blocks STAT monomer production from mRNA.

Similar articles

Cited by

References

    1. O'Brien S, del Giglio A, Keating M. Advances in the biology and treatment of B-cell chronic lymphocytic leukemia. Blood. 1995;85(2):307–318. - PubMed
    1. Döhner H, Stilgenbauer S, Benner A, et al. Genomic aberrations and survival in chronic lymphocytic leukemia. N Engl J Med. 2000;343(26):1910–1916. - PubMed
    1. Rassenti LZ, Huynh L, Toy TL, et al. ZAP-70 compared with immunoglobulin heavy-chain gene mutation status as a predictor of disease progression in chronic lymphocytic leukemia. N Engl J Med. 2004;351(9):893–901. - PubMed
    1. Montserrat E, Moreno C, Esteve J, Urbano-Ispizua A, Gine E, Bosch F. How I treat refractory CLL. Blood. 2006;107(4):1276–1283. - PubMed
    1. Hallek M, Cheson BD, Catovsky D, et al. Guidelines for the diagnosis and treatment of chronic lymphocytic leukemia: a report from the International Workshop on Chronic Lymphocytic Leukemia updating the National Cancer Institute-Working Group 1996 guidelines. Blood. 2008;111(12):5446–5456. - PMC - PubMed

Publication types

MeSH terms