. 2010 Oct;17(10):1551-65.
doi: 10.1038/cdd.2010.32. Epub 2010 Mar 26.

Cytoplasmic polyadenylation element binding protein is a conserved target of tumor suppressor HRPT2/CDC73

Affiliations

Cytoplasmic polyadenylation element binding protein is a conserved target of tumor suppressor HRPT2/CDC73

J-H Zhang et al. Cell Death Differ. 2010 Oct.

Abstract

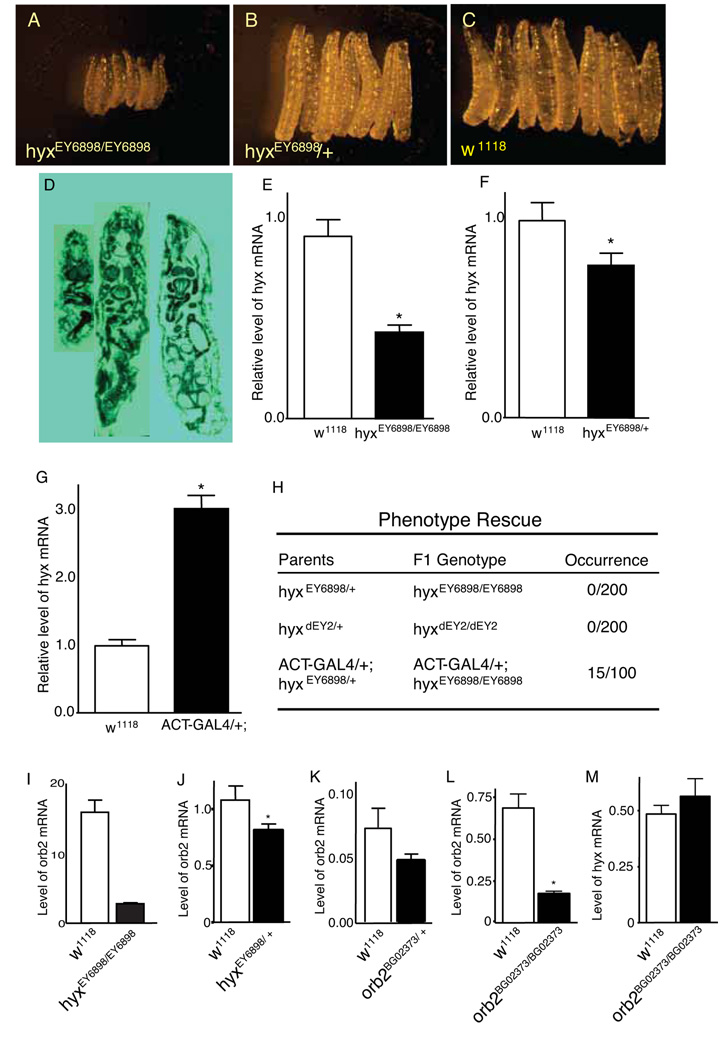
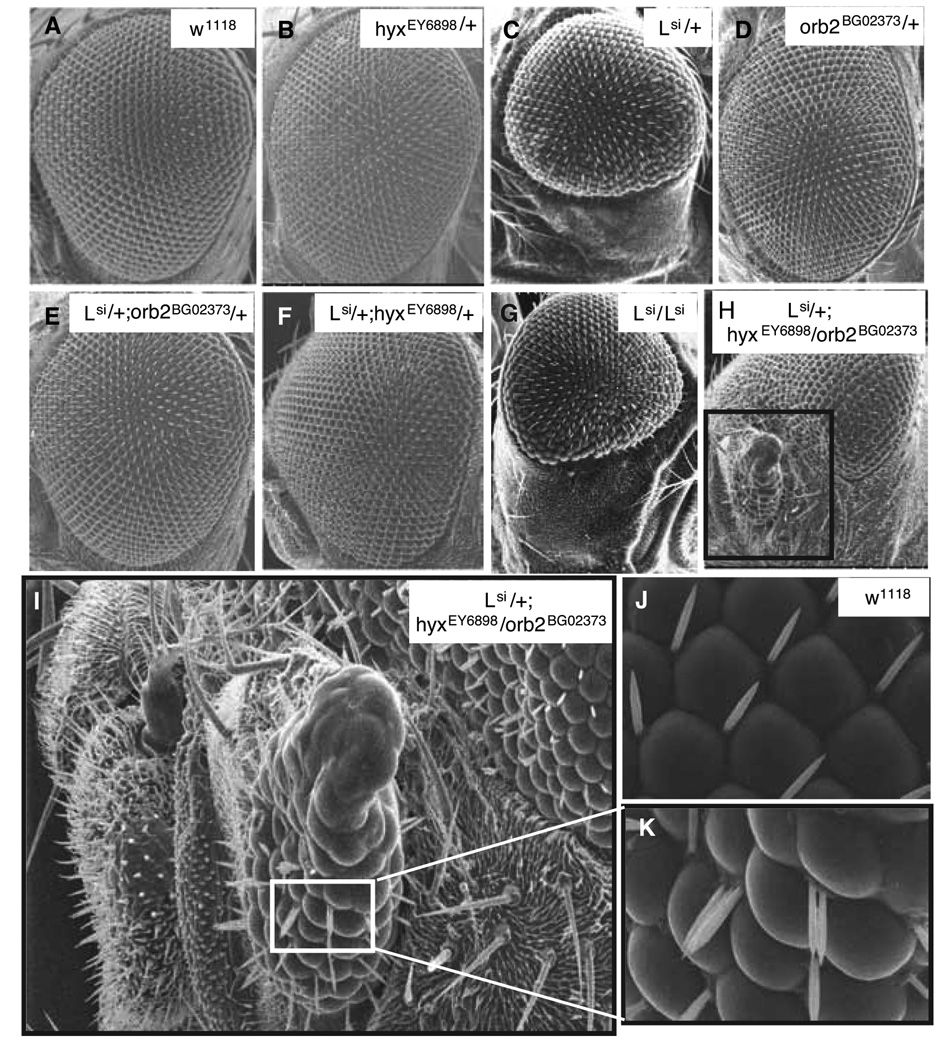
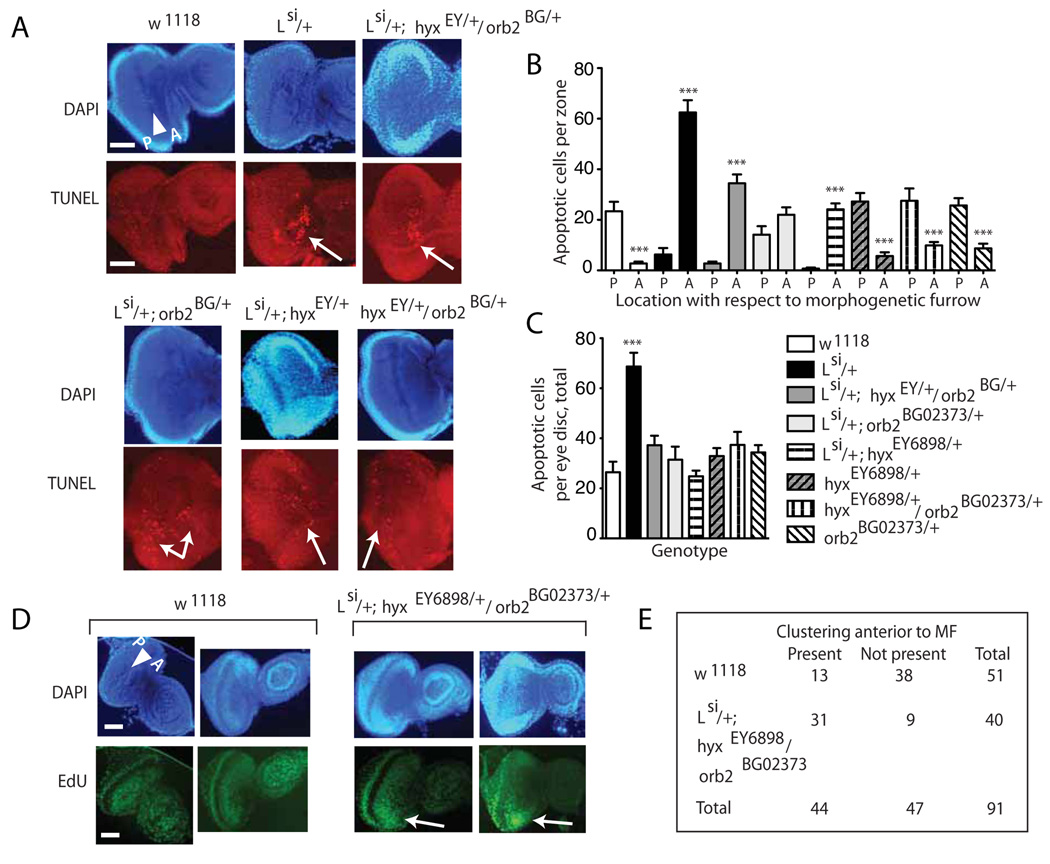
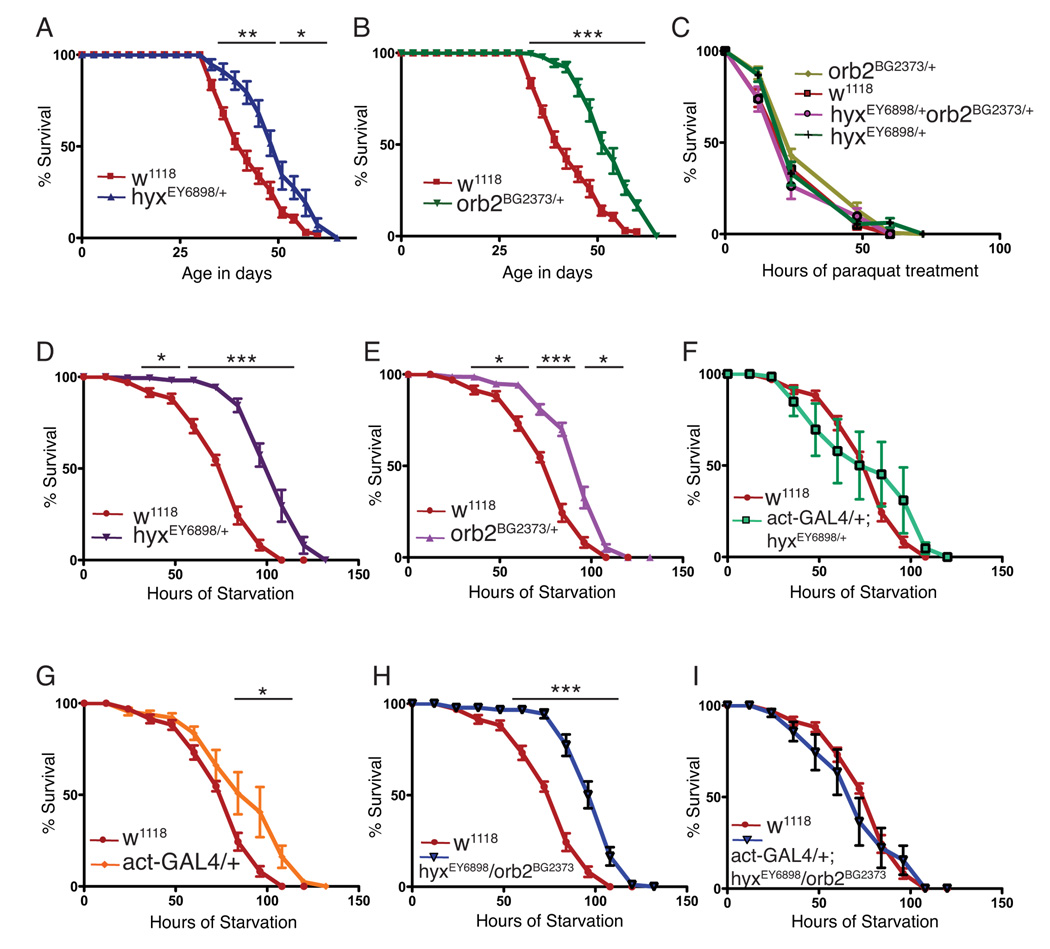
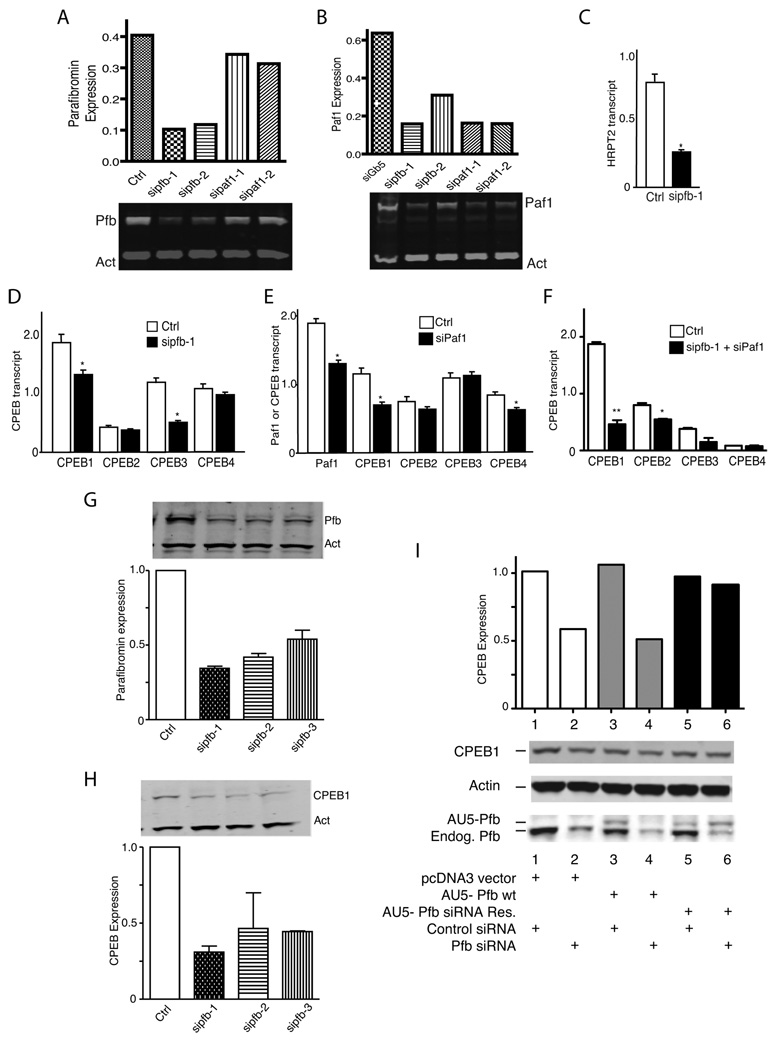
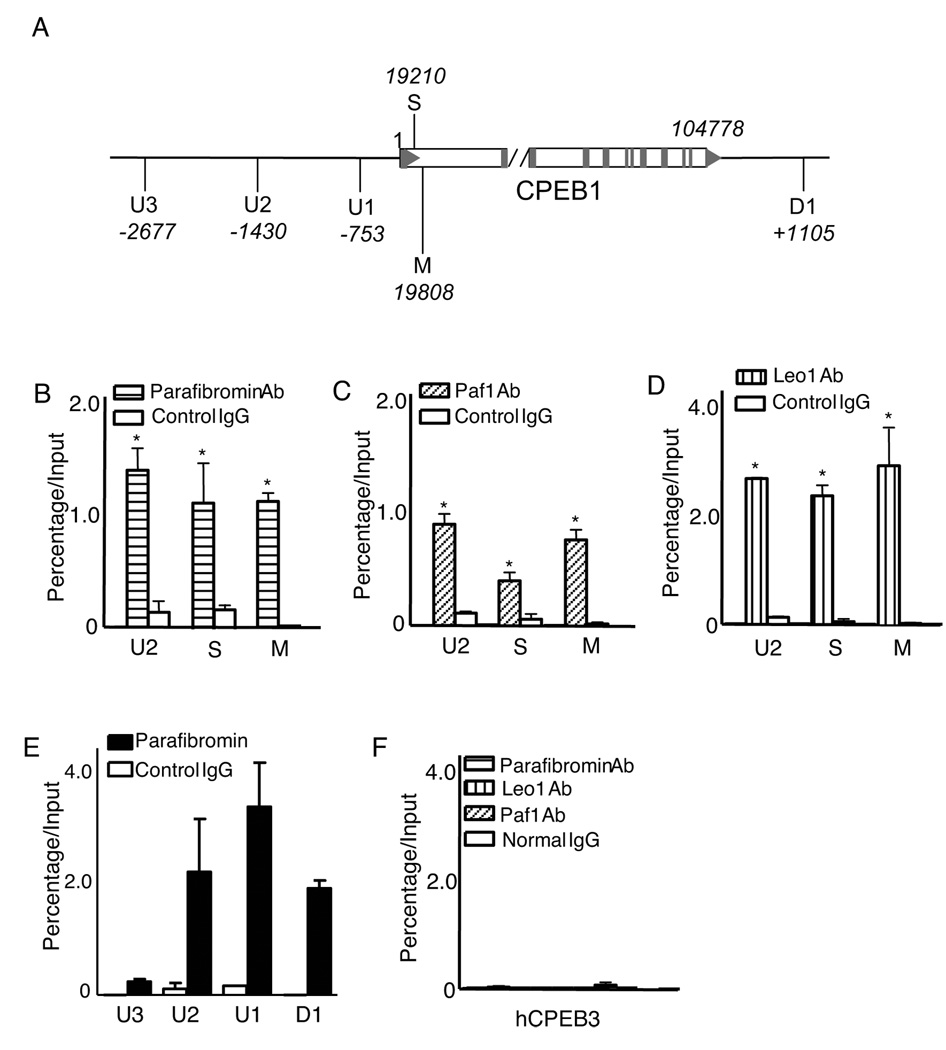
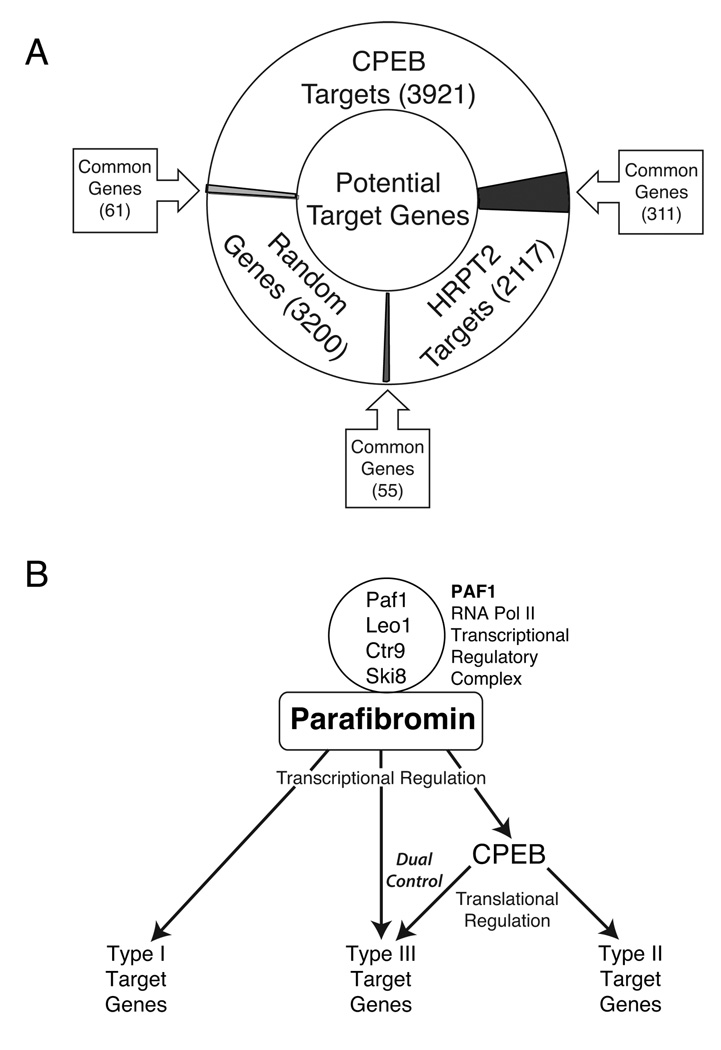
Parafibromin, a tumor suppressor protein encoded by HRPT2/CDC73 and implicated in parathyroid cancer and the hyperparathyroidism-jaw tumor (HPT-JT) familial cancer syndrome, is part of the PAF1 transcriptional regulatory complex. Parafibromin has been implicated in apoptosis and growth arrest, but the mechanism by which its loss of function promotes neoplasia is poorly understood. In this study we report that a hypomorphic allele of hyrax (hyx), the Drosophila homolog of HRPT2/CDC73, rescues the loss-of-ventral-eye phenotype of lobe (Akt1s1). Such rescue is consistent with previous reports that hyx/parafibromin is required for the nuclear transduction of Wingless (Wg)/Wnt signals and that Wg signaling antagonizes lobe function. A screen using double hyx/lobe heterozygotes identified an additional interaction with orb and orb2, the homologs of mammalian cytoplasmic polyadenylation element binding protein (CPEB), a translational regulatory protein. Hyx and orb2 heterozygotes lived longer and were more resistant to starvation than controls. In mammalian cells, knockdown of parafibromin expression reduced levels of CPEB1. Chromatin immunoprecipitation (ChIP) showed occupancy of CPEB1 by endogenous parafibromin. Bioinformatic analysis revealed a significant overlap between human transcripts potentially regulated by parafibromin and CPEB. These results show that parafibromin may exert both transcriptional and, through CPEB, translational control over a subset of target genes and that loss of parafibromin (and CPEB) function may promote tumorigenesis in part by conferring resistance to nutritional stress.


Conflict of interest statement

Conflict of Interest

None of the authors has a conflict of interest that could be perceived as prejudicing the impartiality of the research reported herein.

Figures

Fig 1
Fig 1. Hyrax/HRPT2 is essential for normal larval development in Drosophila and is upstream of the cytoplasmic polyadenylation element-binding protein (CPEB) homolog Orb2
The morphology of second instar larvae were compared between hyxEY6898 homozygous and heterozygous mutants and wild type flies by stereomicroscopy (A–C) and hematoxylin and eosin histological staining (D). Shown in D., left to right, are longitudinal sections of hyxEY6898 homozygous and heterozygous mutants and w1118 larvae. The transcript levels of hyx/HRPT2 were measured by qRT-PCR in both hyxEY6898 homozygous second instar larvae (E) and heterozygous adult (F) flies. Rescue of the hyxEY6898 homozygous lethal phenotype was performed with an actin promoter-controlled GAL4 driven overexpression of the hyx/HRPT2 gene from the hyxEY6898 allele (G–H). For comparison, results with the hyxdEY2 excision mutant are also shown (H). Expression of the orb2 gene in hyxEY6898 homozygous larvae and heterozygous adult flies (I–J) and adult orb2BG02373 heterozygous and homozygous flies (K–L), and hyx/HRPT2 gene expression in orb2BG02373 homozygous mutant flies (M) was quantified by qRT-PCR. For morphology experiments, at least 50 second instar larvae were examined for each genotype. All qRT-PCR data were from at least 9 data points comprising at least three independent biological repeats.
Figure 2
Figure 2. Genetic interaction among lobe/Akt1s1, hyx/HRPT2 and orb2/CPEB evident from Drosophila eye phenotypes
Genetic interactions of flies were recognized by formation of novel notch and overgrowth (NOG) structures at the ventral part of eye after crosses between flies with different genotypic backgrounds. Shown are representative eye phenotypes captured by scanning electron microscopy for wild type (A), heterozygous hyxEY6898 mutant of hyx/HRPT2 (B), heterozygous Lsi mutant of lobe/AKT1S1 (C), heterozygous orb2BG02373 mutant of orb2/CPEB (D); double heterozygous mutants of lobe and orb2 (E), lobe and hyx/HRPT2 (F); homozygous lobe Lsi mutant (G) and triple heterozygous hybrid mutants of lobe, hyx/HRPT2 and orb2 genes (H). Higher magnification image of boxed region of H is shown in I. The ommatidia and sensory bristle phenotype of the triple heterozygous lobe, hyx/HRPT2 and orb2 mutant are shown (I, K). Higher magnification image of boxed region of I is shown in K, with wild type shown for comparison (J).
Figure 3
Figure 3. The imaginal eye disc of triply heterozygous mutant Lsi/+; hyxEY6898/orb2BG02373 larvae is characterized by an abnormal pattern of apoptosis and increased ectopic cellular proliferation
A. DAPI nuclear staining (upper) and TUNEL analysis (lower) of the eye imaginal discs of wild-type, Lsi/+, Lsi/+; hyxEY6898/+/orb2BG02373/+ triple heterozygote, and Lsi/+; hyxEY6898/+Lsi/+; orb2BG02373/+, and hyxEY6898/+;orb2BG02373/+ double heterozygote third instar larvae. White triangle indicates the morphogenetic furrow (MF), with anterior (A) and posterior (P) directionality indicated. Scale bar = 1 mm. Please note that in the legend to A. (and in the legend in C. for the triple heterozygote) the genotype for hyxEY6898/+ is abbreviated hyxEY/+ and the genotype for orb2BG02373/+ is abbreviated to orb2BG/+B. The majority of apoptotic cell nuclei in the wild-type, hyxEY6898/+orb2BG02373/+, and hyxEY6898/+/orb2BG02373/+ eye discs were located posterior (P) to the MF and uniformly distributed whereas the majority of apoptotic nuclei in the Lsi/+ heterozygotes and Lsi/+; hyxEY6898/+/orb2BG02373/+ triple heterozygotes are found anterior (A) to the MF and grouped in large clusters (white arrows in figure part A.). The majority of apoptotic nuclei in the Lsi/+; hyxEY6898/+ double heterozygotes are also localized anterior to the MF, but are dispersed rather than grouped (***, p <0.0001, anterior vs. posterior, 2-tailed t test). There was no significant difference in the anterior and posterior distribution of apoptotic nuclei in Lsi/+; orb2BG02373/+ double heterozygotes (p=0.08, anterior vs. posterior, 2-tailed t test). Legend as in C. C. The total number of TUNEL-positive apoptotic nuclei per eye disc in Lsi/+ heterozygotes is significantly increased compared to wild-type, triple, double and other single heterozygotes (***, p <0.0001, Lsi/+ vs. wt or double, triple or other single heterozygotes, 2-tailed t test). For B. and C. the number of distinct eye imaginal discs counted: wt, n= 20; Lsi/+, n= 22; Lsi/+; hyxEY6898/+/orb2BG02373/+ triple heterozygotes, n= 42; Lsi/+; orb2BG02373/+, n=19; Lsi/+; hyxEY6898/+, n=20; hyxEY6898/+, n=16; orb2BG02373/+, n=16; hyxEY6898/+; orb2BG02373/+, n=16. D. Third instar larvae eye discs of wild-type and Lsi/+; hyxEY6898/orb2BG02373 triple heterozygotes with nuclei stained with DAPI (upper) and proliferating cells stained for the incorporation of the nucleoside 5-ethynyl-2´-deoxyuridine (EdU) (lower) as described in Materials and Methods. Labels in DAPI images as in A. White arrows indicate bright clusters of proliferating cells anterior to MF. E. 2 × 2 contingency table showing the number of wild-type and triple heterozygote eye discs in which bright clusters of proliferating cells anterior to the MF were observed, scored as described in Materials and Methods (n = 51 for wild-type, n = 40 for triple heterozygotes; Fisher’s exact test, 2-tailed p value <0.0001).
Figure 4
Figure 4. Enhanced longevity and starvation resistance in hyx/HRPT2 and Orb2/CPEB mutant flies
The longevity of the indicated heterozygous hyx /HRPT2 and orb2 mutant flies were examined under standard culture conditions as compared to wild type flies (A and B). Survival upon exposure to the herbicide and oxygen free radical–generator paraquat of wild-type and the indicated mutant flies is shown (C). Flies in C were fed with a paraquat-sucrose solution. Survival upon starvation (D–I) of the indicated single or double hyx/HRPT2 and orb2 heterozygous mutants is shown. Flies in D-I were supplied only with water to test starvation resistance. Experiments aimed at the rescue of the hyxEY6898 enhancer trap mutant by mating with a driver strain expressing GAL4 from the 5C-actin promoter (act-GAL4) are shown in F and I, with the driver-only control shown in G. The number of surviving flies was recorded every three days for lifespan tests and daily for stress tests. Ten or more vials were used for each experiment and 3 or more independent experiments were conducted for each fly line. Vials contained 20 flies each for lifespan determination and 10 flies each for stress tests. Each data point shown represents the pooled mean survival from 10 to 12 vials of the indicated genotype, except for the w1118 flies used in stress testing in which each data point represents the pooling of 20 vials (*, p <0.05; **, p <0.001; ***, p <0.0001; vs. wt for the indicated time points, 2-tailed t test).
Figure 5
Figure 5. Knockdown of parafibromin impairs CPEB1 expression at the transcriptional level
The expression of HRPT2, Paf1 and CPEB1-4 genes in human embryonic kidney cells after RNA interference employing siRNAs targeting HRPT2 (sipfb) and Paf1 (sipaf1) as analyzed by immunoblotting using infrared imaging or quantitative RT-PCR is shown. (A) and (B): expression of parafibromin and Paf1 protein by immunoblot (lower panels) and quantification the indicated bands normalized to the actin (Act) loading control by infrared imaging (upper). (C), (D), (E) and (F): transcript levels of the HRPT2, Paf1, and CPEB1-4 genes in HRPT2- and/or Paf1-siRNA treated and control siRNA-treated cells were measured by quantitative RT-PCR. (*, p <0.05; **, p <0.005 vs. control transcript level, 2-tailed t-test) (G) and (H): immunoblot analysis of parafibromin (Pfb) and CPEB1 protein expression in control or HRPT2-siRNA treated cells (insets) with lower histograms showing quantification of expression relative to actin based on infrared imaging of immunoblots. (I): expression of CPEB1 in cells transfected with the empty pcDNA3 vector only, wild-type AU5 epitope-tagged parafibromin cDNA, AU5 epitope-tagged parafibromin cDNA engineered with silent base changes to render it resistant to siPfb-1 siRNA, and either control siRNA or siPfb-1 siRNA, as indicated, was determined by immunoblot (lower panels) and quantified relative to actin, by infrared imaging of immunoblots (upper graph). Experiments shown in A, B, G and H used HEK-293FT cells, while the experiments shown in C, D, E, F, and I used HEK-293 cells. For qRT-PCR each repeat employed triplicate reactions and each data set represents an n= 9 or more. All experiments are representative of three or more independent biological repeats.
Figure 6
Figure 6. Chromatin immunoprecipitation demonstrates occupancy at CPEB1 but not CPEB3 by the PAF1 complex
The physical association of endogenous parafibromin and other components of the PAF1 complex (including the Paf1 and Leo1 proteins) with the human CPEB1 promoter was examined by ChIP in HEK293 cells. (A) Schematic diagram showing the relative location of PCR primer sets employed in the ChIP assay along the human CPEB1 gene and flanking regions (not to scale). The negative numbers associated with U1-U3 indicate upstream position (in bp) of the primer sets relative to transcription start site, the positive number associated with D1 indicates downstream position (in bp) of the primer set relative to the end of the final gene exon. The neutral numbers associated with the early coding sequence (S) and middle coding sequence (M) represent the internal positions (in bp) of the primer sets 3’ to the transcription start site. (B–D): ChIP analysis using primer sets targeting upstream (U2), early coding (S) and middle coding (M) sequence of CPEB1 using either control IgG or antibodies against parafibromin (B), Paf1 (C) and Leo1 (D) proteins as shown. (E) ChIP analysis of parafibromin occupancy of regions upstream or the CPEB1 transcription start site or downstream of the end of the gene using the indicated primer sets. (F) ChIP analysis of the parafibromin, Paf1 and Leo1 occupancy of the human CPEB3 gene using the same ChIPed cell lysates employed in B-E. All experiments are representative of three or more independent biological repeats.
Figure 7
Figure 7. Bioinformatic analysis of potential HRPT2 and CPEB targets suggests duel level of parafibromin gene control
(A) Diagram showing the relationship of potential gene targets of HRPT2 and CPEB1 genes, and a set of randomly chosen genes. Potential HRPT2 targets (2117 genes) were identified by whole genome oligo microarray analysis comparing pools of transcript from HEK293 cells treated with either HRPT2-specific or scrambled control siRNA. Potential CPEB1 targets (3921 genes) were identified from the human genomic database based on the presence of a potential CPE consensus sequence in the 3’ untranslated region. To assess the specificity of the overlapping set of common HRPT2 and CPEB1 target genes, both pools of HRPT2 and CPEB1 potential target genes were also compared to a set of 3200 randomly-selcted human genes. An arrowed square box indicates the overlap identified by each of the three pairings (Fisher’s exact test, 2-tailed p value < 0.002, HRPT2/CPEB vs. HRPT2/Random; < 0.01, CPEB/HRPT2 vs. CPEB/Random). (B) Model illustrating three types of potential targets of parafibromin in association with PAF1 transcriptional regulatory complex: type I, regulated only transcriptionally (e.g. genes identified by whole genome oligo microarray analysis, not including the genes overlapping with CPEB1 targets); type II, regulated indirectly at the level of translation through CPEB1 (e.g. genes identified by CPE consensus sequence analysis, not including the genes overlapping with HRPT2 targets); and type III, regulated dually by transcription and indirectly by translational effects via CPEB1 (e.g. genes common to both HRPT2 and CPEB1 target gene pools). This model of dual regulation does not exclude the additional possibility of CPEB regulation by parafibromin involving direct physical complex formation, since the CPEB-binding scaffolding protein symplekin has been found in anti-parafibromin immunoprecipitates (18).

Similar articles

Cited by

References

    1. Jackson CE, Norum RA, Boyd SB, Talpos GB, Wilson SD, Taggart RT, et al. Hereditary hyperparathyroidism and multiple ossifying jaw fibromas: a clinically and genetically distinct syndrome. Surgery. 1990;108:1006–1012. - PubMed
    1. Mallette LE, Malini S, Rappaport MP, Kirkland JL. Familial cystic parathyroid adenomatosis. Ann Intern Med. 1987;107:54–60. - PubMed
    1. Teh BT, Farnebo F, Kristoffersson U, Sundelin B, Cardinal J, Axelson R, et al. Autosomal dominant primary hyperparathyroidism and jaw tumor syndrome associated with renal hamartomas and cystic kidney disease: linkage to 1q21-q32 and loss of the wild type allele in renal hamartomas. J Clin Endocrinol Metab. 1996;81:4204–4211. - PubMed
    1. Teh BT, Farnebo F, Twigg S, Höög A, Kytölä S, Korpi-Hyövälti E, et al. Familial isolated hyperparathyroidism maps to the hyperparathyroidism-jaw tumor locus in 1q21-q32 in a subset of families. J Clin Endocrinol Metab. 1998;83:2114–2120. - PubMed
    1. Simonds WF, James-Newton LA, Agarwal SK, Yang B, Skarulis MC, Hendy GN, et al. Familial isolated hyperparathyroidism: Clinical and genetic characteristics of thirty-six kindreds. Medicine (Baltimore) 2002;81:1–26. - PubMed

Publication types

MeSH terms

LinkOut - more resources