

Dinucleotide weight matrices for predicting transcription factor binding sites: generalizing the position weight matrix
- PMID: 20339533
- PMCID: PMC2842295
- DOI: 10.1371/journal.pone.0009722
Dinucleotide weight matrices for predicting transcription factor binding sites: generalizing the position weight matrix
Abstract
Background: Identifying transcription factor binding sites (TFBS) in silico is key in understanding gene regulation. TFBS are string patterns that exhibit some variability, commonly modelled as "position weight matrices" (PWMs). Though convenient, the PWM has significant limitations, in particular the assumed independence of positions within the binding motif; and predictions based on PWMs are usually not very specific to known functional sites. Analysis here on binding sites in yeast suggests that correlation of dinucleotides is not limited to near-neighbours, but can extend over considerable gaps.
Methodology/principal findings: I describe a straightforward generalization of the PWM model, that considers frequencies of dinucleotides instead of individual nucleotides. Unlike previous efforts, this method considers all dinucleotides within an extended binding region, and does not make an attempt to determine a priori the significance of particular dinucleotide correlations. I describe how to use a "dinucleotide weight matrix" (DWM) to predict binding sites, dealing in particular with the complication that its entries are not independent probabilities. Benchmarks show, for many factors, a dramatic improvement over PWMs in precision of predicting known targets. In most cases, significant further improvement arises by extending the commonly defined "core motifs" by about 10 bp on either side. Though this flanking sequence shows no strong motif at the nucleotide level, the predictive power of the dinucleotide model suggests that the "signature" in DNA sequence of protein-binding affinity extends beyond the core protein-DNA contact region.
Conclusion/significance: While computationally more demanding and slower than PWM-based approaches, this dinucleotide method is straightforward, both conceptually and in implementation, and can serve as a basis for future improvements.
Conflict of interest statement
Figures

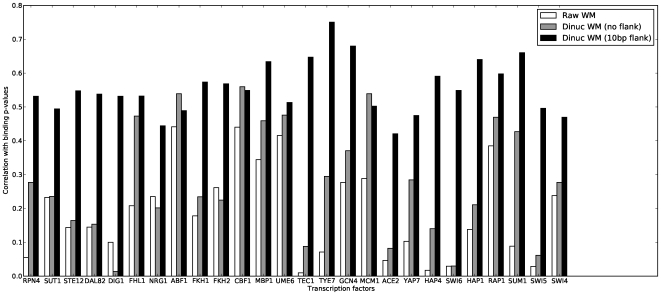
 -values reported by Harbison et al.
, using the “raw” position weight matrices from MacIsaac et al.
, dinucleotide weight matrices with the same “width” as the “raw” matrices, and dinucleotide weight matrices with a 10bp “flanking sequence” on either side of the input matrices. Details are in Materials and Methods.
-values reported by Harbison et al.
, using the “raw” position weight matrices from MacIsaac et al.
, dinucleotide weight matrices with the same “width” as the “raw” matrices, and dinucleotide weight matrices with a 10bp “flanking sequence” on either side of the input matrices. Details are in Materials and Methods.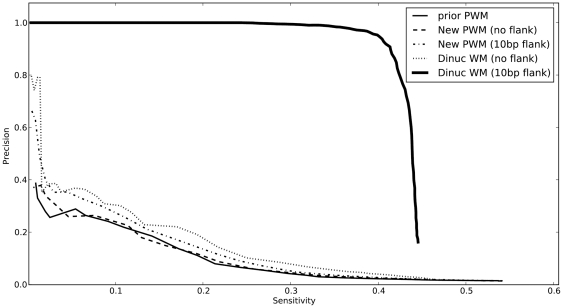
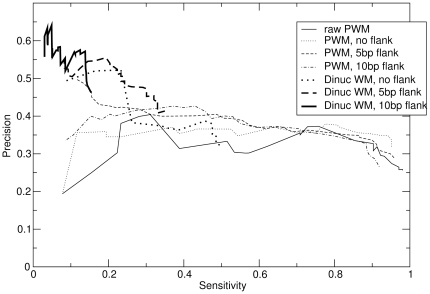
 that correspond to documented target genes. The sensitivity is fraction of known targets that are predicted above that cutoff. These are for the same benchmark data as in Figure 2.

References
-
- Berg OG, von Hippel PH. Selection of DNA binding sites by regulatory proteins : Statistical-mechanical theory and application to operators and promoters. Journal of Molecular Biology. 1987;193:723–743. - PubMed
-
- Hertz GZ, Hartzell GW, Stormo GD. Identification of consensus patterns in unaligned DNA sequences known to be functionally related. Comput Appl Biosci. 1990;6:81–92. - PubMed
Publication types
MeSH terms
Substances
LinkOut - more resources
Full Text Sources
Molecular Biology Databases
