. 2010:2010:819414.
doi: 10.1155/2010/819414. Epub 2010 Mar 18.

Chronic sleep disturbance impairs glucose homeostasis in rats

Affiliations

Chronic sleep disturbance impairs glucose homeostasis in rats

R Paulien Barf et al. Int J Endocrinol. 2010.

Abstract

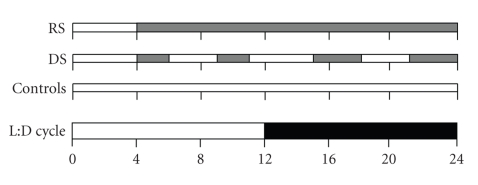
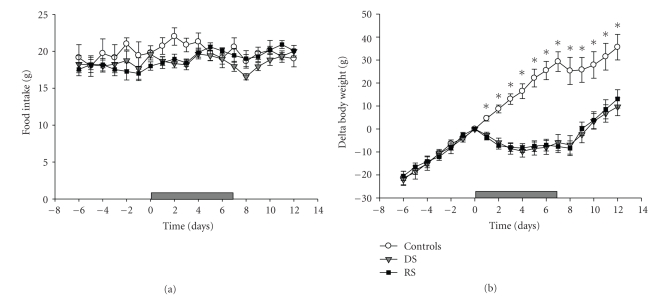
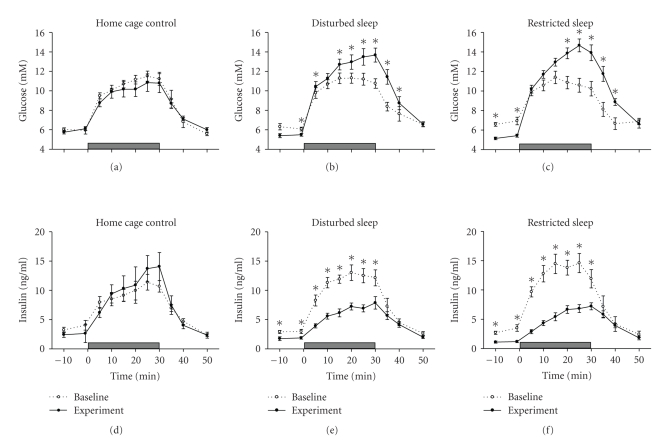
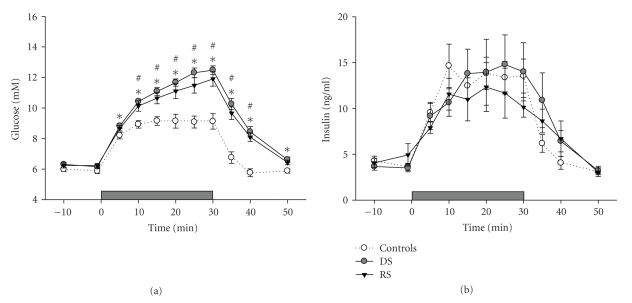
Epidemiological studies have shown an association between short or disrupted sleep and an increased risk for metabolic disorders. To assess a possible causal relationship, we examined the effects of experimental sleep disturbance on glucose regulation in Wistar rats under controlled laboratory conditions. Three groups of animals were used: a sleep restriction group (RS), a group subjected to moderate sleep disturbance without restriction of sleep time (DS), and a home cage control group. To establish changes in glucose regulation, animals were subjected to intravenous glucose tolerance tests (IVGTTs) before and after 1 or 8 days of sleep restriction or disturbance. Data show that both RS and DS reduce body weight without affecting food intake and also lead to hyperglycemia and decreased insulin levels during an IVGTT. Acute sleep disturbance also caused hyperglycemia during an IVGTT, yet, without affecting the insulin response. In conclusion, both moderate and severe disturbances of sleep markedly affect glucose homeostasis and body weight control.


Figures

Figure 1
Figure 1
Schematic overview of the sleep disturbance protocols for the restricted sleep group (RS), disturbed sleep group (DS), and control group. For each treatment group, periods of wakefulness induced by forced locomotion are shown in light grey. The RS group was subjected daily to one consolidated block of 20-hour forced activity while the DS group was subjected to blocks of 2-3-hour forced activity interspersed by 3-4-hour blocks of rest. Control animals were left undisturbed.
Figure 2
Figure 2
Average daily food intake (a) and body weight (b) in the baseline, experimental, and recovery phase of the experiment for RS (n = 11), DS (n = 12), and control (n = 7) animals. The horizontal grey bars at the bottom of the graphs represent the 8-day period of RS or DS. Data are average values ± SEM. Asterisks indicate a significant difference between sleep disturbed (DS and RS) and control animals (*P < .01).
Figure 3
Figure 3
Blood glucose and plasma insulin levels in response to a 30-minutes intravenous glucose infusion after 8 days of sleep restriction (graphs (c) and (f), n = 11), sleep disturbance (graphs (b) and (e), n = 12), or control (graphs (a) and (d), n = 7). Each graph presents the glucose or insulin profiles under pre-experimental baseline conditions (Baseline: open circles) and after 8 days of sleep disturbance (Experiment: closed circles). The horizontal grey bars at the bottom of each graph represent the 30 minutes of 15% glucose infusion. Data are average values ± SEM. Asterisks indicate a significant difference between baseline and experimental conditions (*P < .05).
Figure 4
Figure 4
Blood glucose (a) and plasma insulin levels (b) in response to a 30-minutes intravenous glucose infusion after 1 day of sleep restriction (closed triangles, n = 8), sleep disturbance (closed circles, n = 8), or control (open circles, n = 8). The horizontal grey bars at the bottom of the graphs represent the 30 minutes of 15% glucose infusion. Data are average values ± SEM. Asterisks indicate a significant difference between sleep restricted rats and controls (*P < .05) and # indicates a significant difference between sleep disturbed rats and controls (# P < .05).

References

    1. Cappuccio FP, Taggart FM, Kandala N-B, et al. Meta-analysis of short sleep duration and obesity in children and adults. Sleep. 2008;31(5):619–626. - PMC - PubMed
    1. Chaput J-P, Brunet M, Tremblay A. Relationship between short sleeping hours and childhood overweight/obesity: results from the ‘Québec en Forme’ Project. International Journal of Obesity. 2006;30(7):1080–1085. - PubMed
    1. Chaput J-P, Després J-P, Bouchard C, Tremblay A. Association of sleep duration with type 2 diabetes and impaired glucose tolerance. Diabetologia. 2007;50(11):2298–2304. - PubMed
    1. Gottlieb DJ, Punjabi NM, Newman AB, et al. Association of sleep time with diabetes mellitus and impaired glucose tolerance. Archives of Internal Medicine. 2005;165(8):863–867. - PubMed
    1. Knutson KL, Spiegel K, Penev P, Van Cauter E. The metabolic consequences of sleep deprivation. Sleep Medicine Reviews. 2007;11(3):163–178. - PMC - PubMed

LinkOut - more resources