Review
. 2011 May;67 Suppl 1(Suppl 1):5-16.
doi: 10.1007/s00228-009-0782-9. Epub 2010 Mar 26.

The role of population PK-PD modelling in paediatric clinical research

Affiliations
Review

The role of population PK-PD modelling in paediatric clinical research

Roosmarijn F W De Cock et al. Eur J Clin Pharmacol. 2011 May.

Abstract

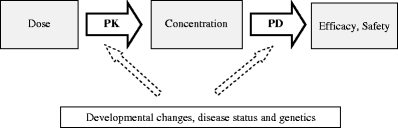
Children differ from adults in their response to drugs. While this may be the result of changes in dose exposure (pharmacokinetics [PK]) and/or exposure response (pharmacodynamics [PD]) relationships, the magnitude of these changes may not be solely reflected by differences in body weight. As a consequence, dosing recommendations empirically derived from adults dosing regimens using linear extrapolations based on body weight, can result in therapeutic failure, occurrence of adverse effect or even fatalities. In order to define rational, patient-tailored dosing schemes, population PK-PD studies in children are needed. For the analysis of the data, population modelling using non-linear mixed effect modelling is the preferred tool since this approach allows for the analysis of sparse and unbalanced datasets. Additionally, it permits the exploration of the influence of different covariates such as body weight and age to explain the variability in drug response. Finally, using this approach, these PK-PD studies can be designed in the most efficient manner in order to obtain the maximum information on the PK-PD parameters with the highest precision. Once a population PK-PD model is developed, internal and external validations should be performed. If the model performs well in these validation procedures, model simulations can be used to define a dosing regimen, which in turn needs to be tested and challenged in a prospective clinical trial. This methodology will improve the efficacy/safety balance of dosing guidelines, which will be of benefit to the individual child.


Figures

Fig. 1
Fig. 1
Schematic representation of the relationship between dose and concentration (pharmacokinetics, PK) and between concentration and a pharmacological (side) effect (pharmacodynamics, PD). Important covariates that may affect both the PK and/or PD are body weight, age, disease status (e.g. critically ill versus healthy children) and genetics
Fig. 2
Fig. 2
Simulation of propofol concentrations and response using COMFORT-B score versus time based on developed PK and PD models, after administration of different doses of propofol (0, 18, 30, and 36 mg/h) for a 10-kg and a 5-kg non-ventilated infant in the first night at the Intensive Care Unit following craniofacial surgery. Target COMFORT-B scores are between 12 and 14 preferably. Reproduced from [Peeters MY, Prins SA, Knibbe CA, DeJongh J, van Schaik RH, van Dijk M, et al. Propofol pharmacokinetics and pharmacodynamics for depth of sedation in nonventilated infants after major craniofacial surgery. Anesthesiology 2006 Mar;104(3):466-74.]
Fig. 3
Fig. 3
Concentration–time profiles of the same study using two different approaches. In a the standard two-stage approach is applied to a rich dataset. b shows the population approach with mixed effect modelling applied to the same dataset using only two data points for each individual so that a sparse dataset is created. In a, in each of the six individuals 10 samples are available. The different symbols correspond to different individuals. Each black line corresponds to a separate fit to the 10 data points of each individual. In b, which uses the mixed effect modelling approach, two samples of the 10 per subject in a are used. The different symbols correspond to the six different individuals. The black line illustrates the concentration–time plot based on the population mean values of the PK parameters (PRED). The grey lines show the plots of the individual patients, which are based on the population mean values together with the measured concentrations of the specific individual (IPRED)
Fig. 4
Fig. 4
In a, the inter-individual variability among three individuals who received the same dose is shown. b presents the intra-individual or residual variability by showing the concentration–time profile after repeated administration. Both these random variables are assumed to be normally distributed with a mean of zero and a variance of ω2 or σ2 respectively
Fig. 5
Fig. 5
Two examples of a visual predictive check (VPC) are illustrated based on the same dataset (warfarin concentrations and prothrombin complex activity [PCA]) using two different models. In a the VPC of the effect compartment is shown, while in b the VPC of the turnover model is demonstrated. Both real (grey) and simulated (black) data are displayed with mean (thick lines) and 95% intervals (thin lines). Based on both graphics, the turnover model is the most appropriate model since real and simulated lines are in good agreement. Reproduced from [Karlsson, M. O. and N. H. G. Holford (2008). “A Tutorial on Visual Predictive Checks.” PAGE 17 (2008) Abstr 1434 (www.page-meeting.org/?abstract=1434)]
Fig. 6
Fig. 6
Example of a normalised prediction distribution error (NPDE) analysis, which shows the NPDE distributions for morphine. The normal distribution is represented by the solid line. The values for the mean and standard deviation of the observed NPDE distribution are given below the histogram, with an asterisk indicating a significant difference of a mean of 0 and a variance of 1 at the P < 0.05 level, as determined by the Wilcoxon signed rank test and Fisher’s test for variance. The distribution of NPDE vs time after the first dose and NPDE vs the log of the concentrations are also shown. The dotted lines represent the 90% distribution of the NPDE. Reproduced from [Knibbe CA, Krekels EH, van den Anker JN, DeJongh J, Santen GW, van Dijk M, et al. Morphine glucuronidation in preterm neonates, infants and children younger than 3 years. Clin Pharmacokinet 2009;48(6):371-85] with permission from Wolters Kluwer Health | Adis (© Adis Data Information BV [2006]). All rights reserved

Similar articles

Cited by

References

    1. Ernest TB, Elder DP, Martini LG, et al. Developing paediatric medicines: identifying the needs and recognizing the challenges. J Pharm Pharmacol. 2007;59(8):1043–1055. doi: 10.1211/jpp.59.8.0001. - DOI - PubMed
    1. Jong GW, Vulto AG, de Hoog M, et al. A survey of the use of off-label and unlicensed drugs in a Dutch children’s hospital. Pediatrics. 2001;108(5):1089–1093. doi: 10.1542/peds.108.5.1089. - DOI - PubMed
    1. Conroy S, Choonara I, Impicciatore P, et al. Survey of unlicensed and off label drug use in paediatric wards in European countries. European Network for Drug Investigation in Children. BMJ. 2000;320(7227):79–82. doi: 10.1136/bmj.320.7227.79. - DOI - PMC - PubMed
    1. Tod M, Jullien V, Pons G. Facilitation of drug evaluation in children by population methods and modelling. Clin Pharmacokinet. 2008;47(4):231–243. doi: 10.2165/00003088-200847040-00002. - DOI - PubMed
    1. Bray RJ. Propofol infusion syndrome in children. Paediatr Anaesth. 1998;8(6):491–499. doi: 10.1046/j.1460-9592.1998.00282.x. - DOI - PubMed

Publication types