

Review
doi: 10.1021/jm100112j.
A medicinal chemist's guide to molecular interactions
Affiliations
- PMID: 20345171
- PMCID: PMC2905122
- DOI: 10.1021/jm100112j
Item in Clipboard
Review
A medicinal chemist's guide to molecular interactions
J Med Chem.
.
Free PMC article
Erratum in
- J Med Chem. 2010 Aug 26;53(16):6241
No abstract available
Figures
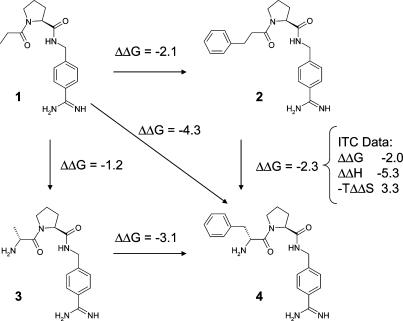
Cooperativity of hydrogen bond formation and hydrophobic contacts in a set of thrombin inhibitors. Extension of the lipophilic side chain alone increases affinity by 2.1 kcal/mol. Addition of the amino group increases affinity by 1.2 kcal/mol. Cooperativity therefore amounts to 4.3 − 2.1 − 1.2 = 1.0 kcal/mol. Data from refs (30) and (31) were converted to kcal/mol and rounded to 1 decimal place.

Binding mode of a factor Xa inhibitor from GSK.(40) The depicted compound (PDB code 2j4i) has a Ki of 1 nM. Replacing the isopropyl group (marked in red) by hydrogen reduces the affinity to 39 μM.

Overlay of representatives of 15 different PDE10 inhibitor classes. Two water molecules are deeply buried in the binding site of the apo form and are hydrogen-bonded to two (left) and three (right) protein residues, respectively. Only the less tightly bound water molecule has been displaced by PDE10 inhibitors so far.
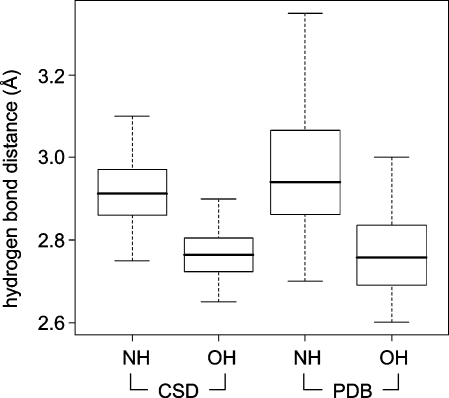
Box plots (box region corresponding to the central 50% of the distribution, dotted lines extending to max 1.5 times this interval) of hydrogen bond length distributions with NH and OH as donors: (left) CSD statistics; (right) PDB statistics. In the PDB, the distributions around roughly the same mean are significantly broader.
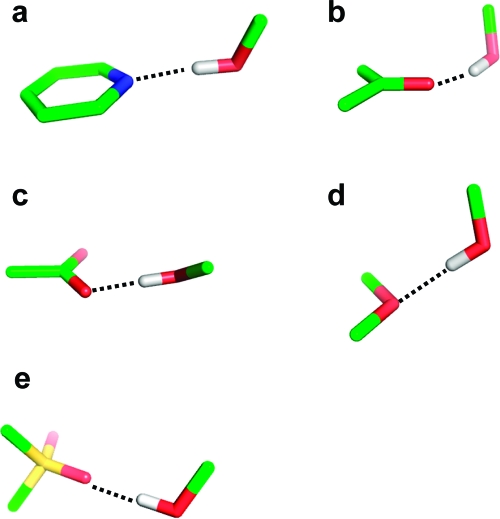
Schematic depiction of the most preferred geometries of hydrogen bond interactions with various types of acceptors: (a) pyridine nitrogen, (b) carbonyl oxygen, (c) carboxylic acid, (d) ether oxygen, (e) sulfonyl group.
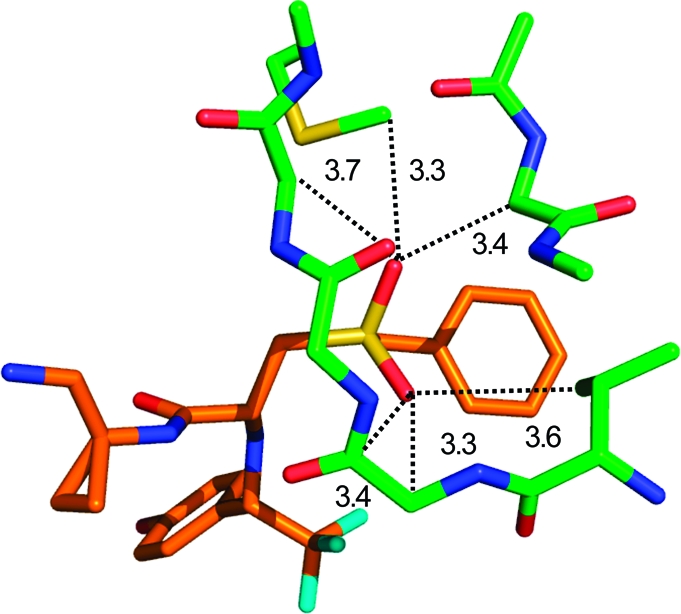
Closest interactions (distances in Å) formed by the sulfonyl oxygen atoms of a cathepsin S ligand within the active site (PDB code 2fra). Most side chains have been omitted for clarity.

Structures referred to as NH···π interactions in the literature. (a) Chk1 kinase ligands. The orange structure has a Ki of 8.5 μM (PDB code 2c3l), and the green structure has a Ki of 0.026 μM (PDB code 2c3k).(122) The additional phenyl ring displaces several water molecules, one of which was coordinated to the backbone NH below. The shortest NH···phenyl distance in the green structure is 3.4 Å. (b) A PDE10 complex structure with a reported NH···π contact(123) where in reality the glutamine side chain forms two classical hydrogen bonds to water and a tyrosine. Distances are in Å.
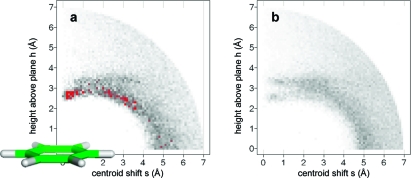
Radial distribution of hydrogen atoms around a phenyl ring (CSD statistics): (a) hydrogen bound to sp2 carbon flanked by one or two heteroatoms (N, O); (b) hydrogen bound to O or N. Queries were set up as described in Materials and Methods. The phenyl ring in (a) is drawn roughly to scale and should serve as an interpretation aid for the in-plane (s) and above-plane distances (h). Darker gray corresponds to higher density; peaks above a numerical value of 70 are colored red.

Box plots of hydrogen bond length distributions for the interaction between weak and strong donors and amide carbonyl oxygen as acceptor (CSD statistics). An increase in median hydrogen bond length and in breadth of the distribution is observed for decreasing donor strength.
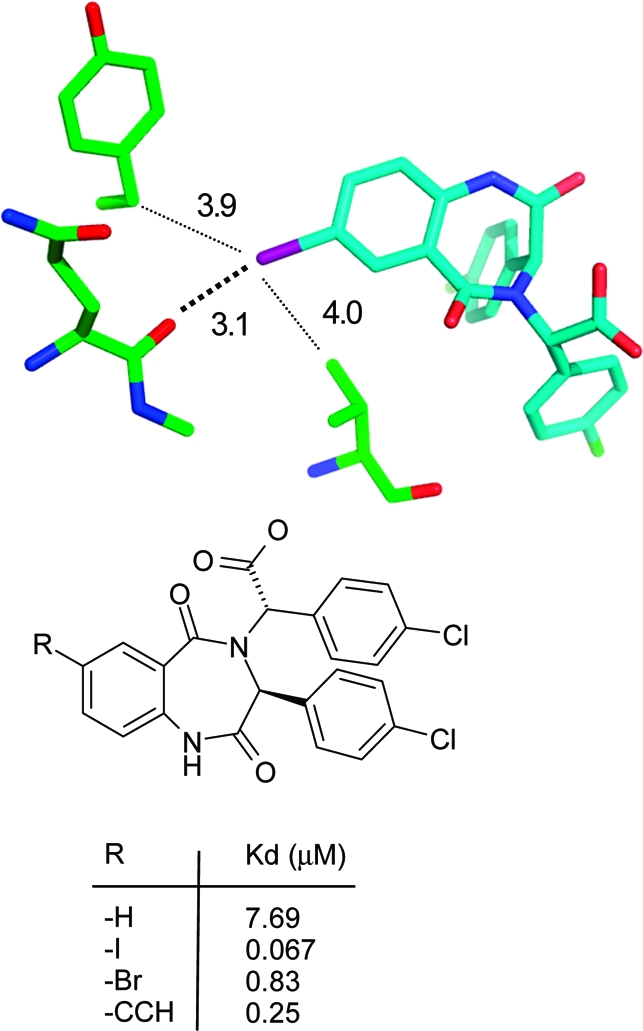
Iodine bond to a backbone carbonyl group in a HDM2 p53 domain crystal structure(145) (PDB code 1t4e, distances in Å).
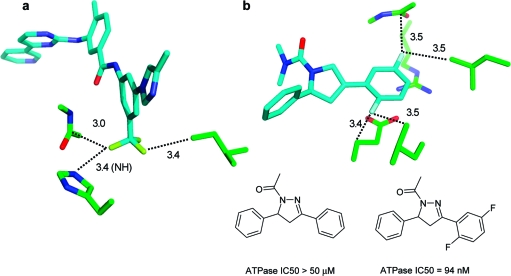
(a) Fluorine interactions in the complex between nilotinib and abl kinase (PDB code 3cs9).(159) (b) Kinesin spindle protein structure (2fl6) and activity data of two closely related inhibitor structures.(160)Distances are in Å.
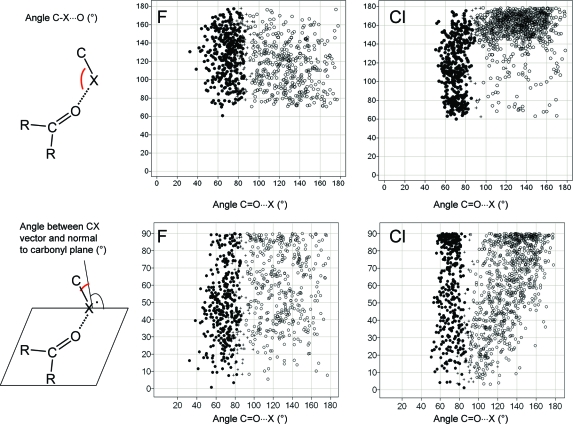
Occurrence of close contacts between F (left) and Cl (right) atoms and carbonyl groups in the CSD. Scatter plots show two different angle distributions. Points are categorized by their distance to the carbon and oxygen atoms of the C=O unit: (●) close contact between halogen and carbonyl C (<3.3 Å for F, <3.5 Å for Cl); (○) close contact between halogen and carbonyl O (<3.1 Å for F, <3.3 Å for Cl); (+) both close contact criteria satisfied.
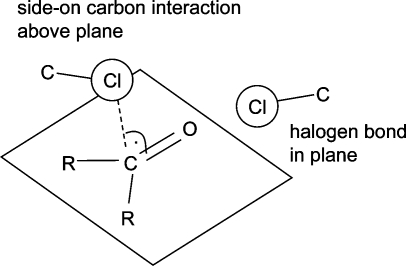
Preferred interaction geometries between chlorine and carbonyl groups derived from the CSD queries in Figure 12.
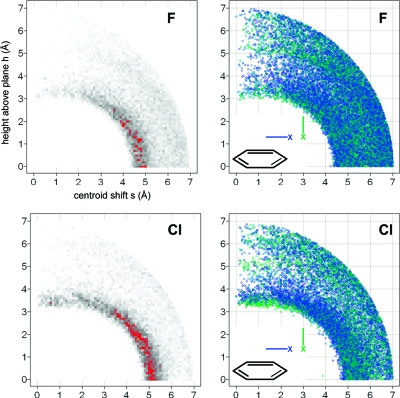
Radial distribution of fluorine atoms (top) and chlorine atoms (bottom) around phenyl rings (CSD statistics). Darker gray corresponds to higher density; peaks above a numerical value of 90 are colored red. Scatter plots of all hits for fluorine and chlorine (right-hand side) are colored by the angle between the phenyl plane and the C−X vector from blue (0°, in plane) to green (90°, orthogonal).
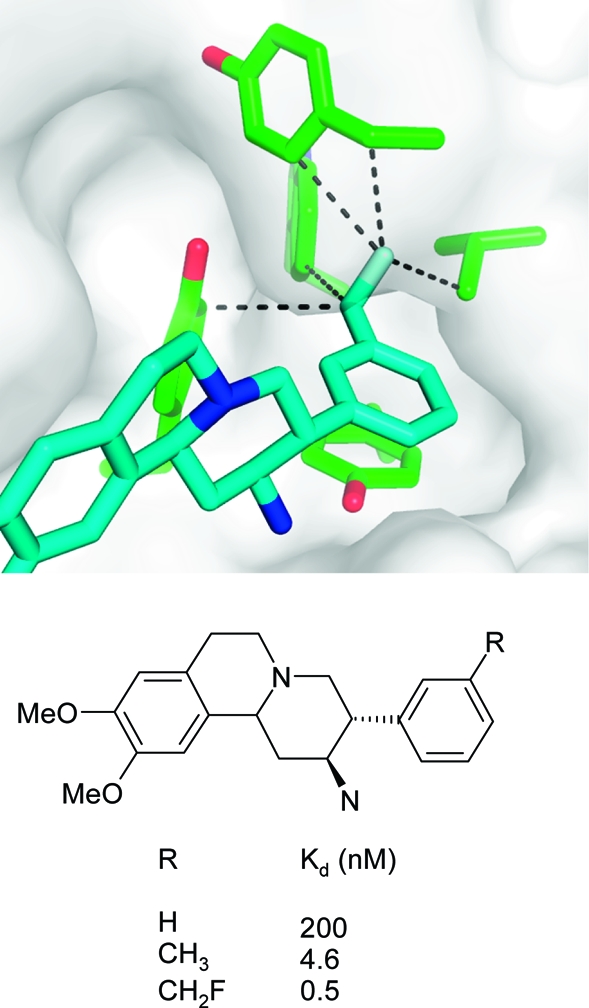
X-ray complex crystal structure of human DPP-IV with an aminobenzoquinolizine inhibitor (R = CH2F) and affinity data for three derivatives.(180) The closest hydrophobic protein contacts of the CH2F moiety (distances are less than the sum of van der Waals radius + 0.5 Å) are displayed (PDB code 3kwj).

Radial distribution of carbon atoms around phenyl rings: (a) CH3 bound to sp3 C (CSD statistics); (b) CH3 bound to O or N (CSD statistics); (c) CH3 bound to O or N (PDB statistics). Darker gray corresponds to higher density; peaks above a numerical value of 90 are colored red.
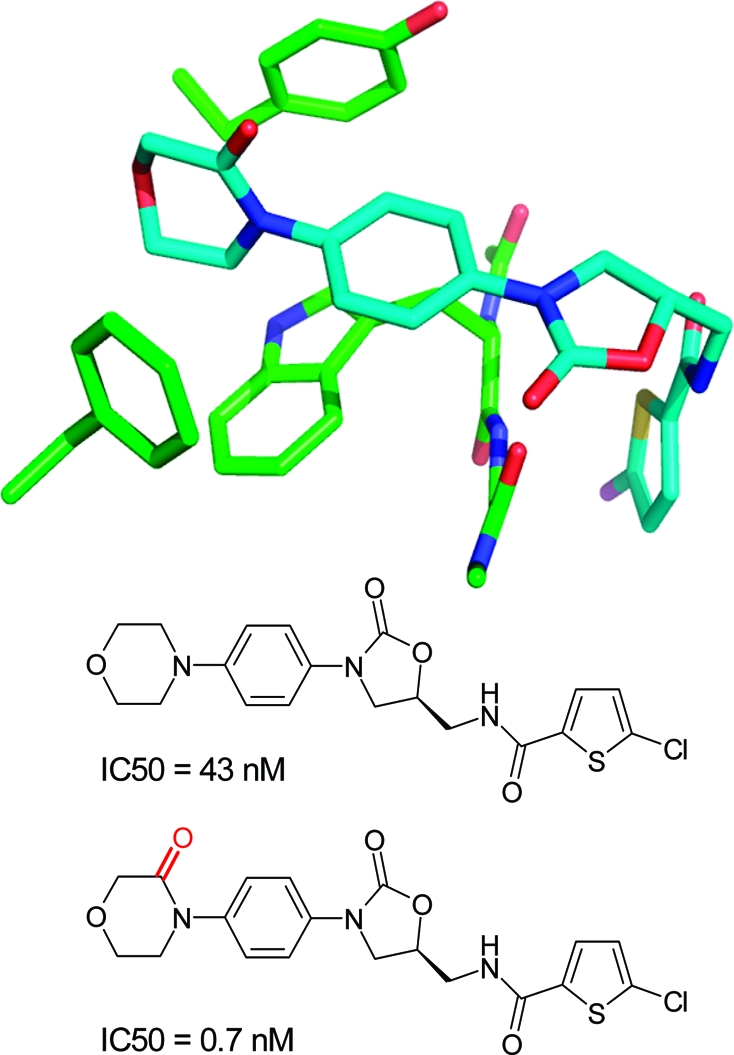
Structure and IC50 values(168) of factor Xa inhibitors (PDB code 2w26, distances in Å).
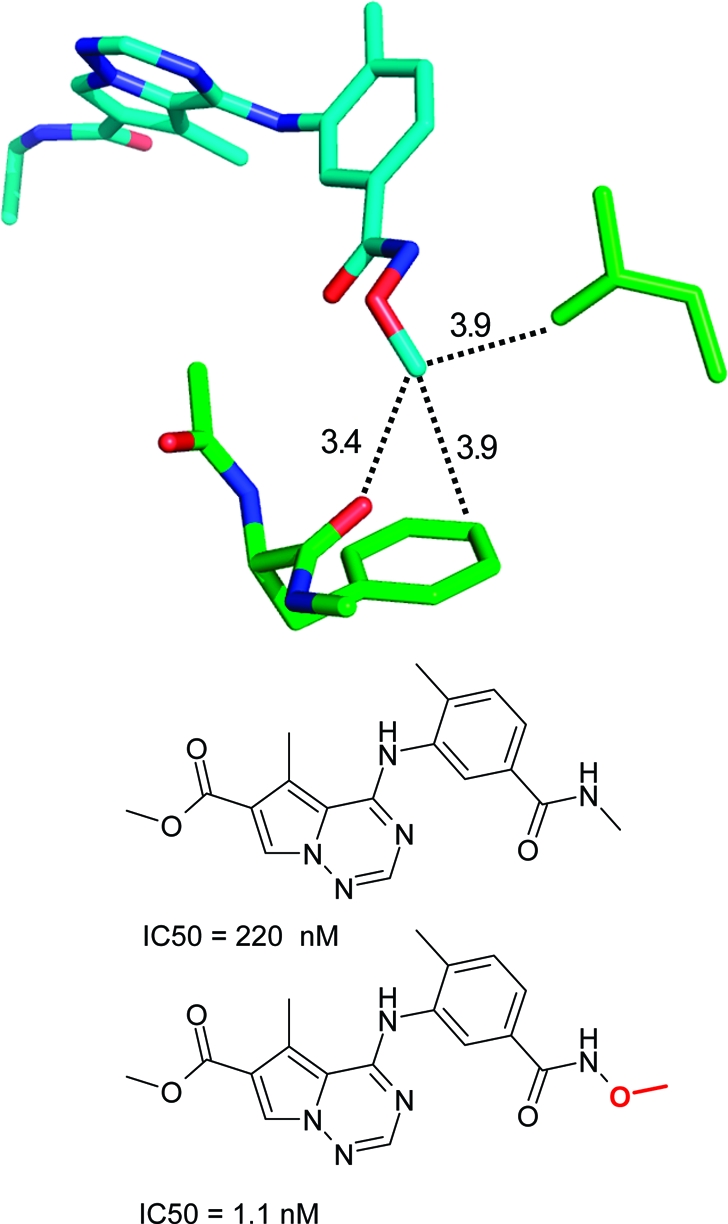
Effect of a methyl group on the IC50 of a p38 MAP kinase inhibitor(198) (PDB code 2rg5).
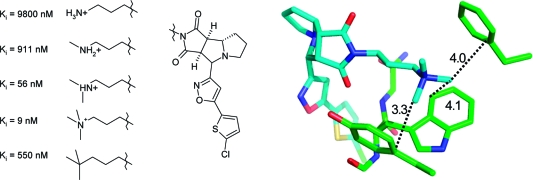
Example of cation−π interactions: a factor Xa inhibitor scaffold with systematically varied S4 pocket side chains (PDB code 2bok, distances in Å).(209)
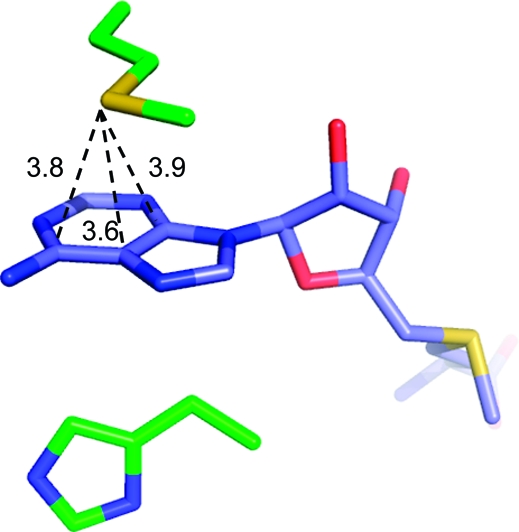
Interaction between methionine and adenine in the complex between S-adenosylmethionine and catechol-O-methyltranferase (PDB code 2cl5, distances in Å).
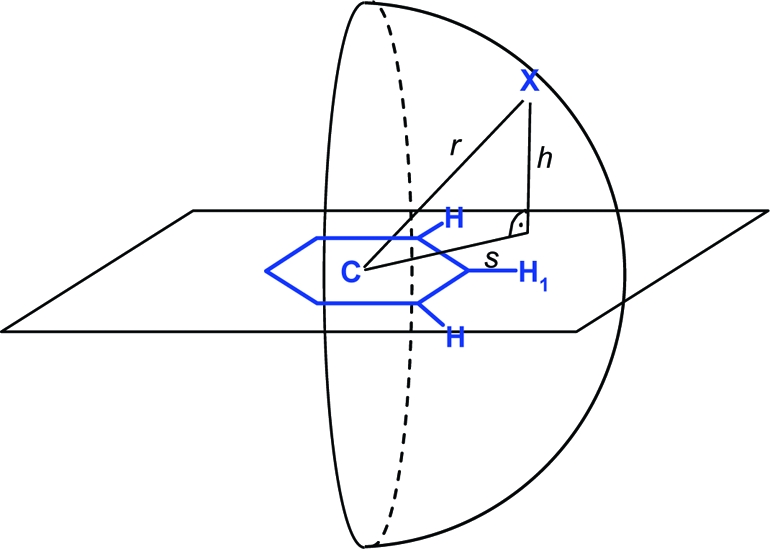
Query setup used for searching interactions between query atoms X and phenyl rings.
References
-
- Allen F. H. The Cambridge Structural Database: a quarter of a million crystal structures and rising. Acta Crystallogr. 2002, B58, 380–388. - PubMed
-
- Bernstein F. C.; Koetzle T. E.; Williams G. J. B.; Meyer J., E. F.; Brice M. D.; Rodgers J. R.; Kennard O.; Shimanouchi T.; Tasumi M. The protein data bank: a computer-based archival file for macromolecular structures. J. Mol. Biol. 1977, 112, 535–542; http://www.rcsb.org/pdb/. - PubMed
-
- Mark A. E.; van Gunsteren W. F. Decomposition of the free energy of a system in terms of specific interactions. Implications for theoretical and experimental studies. J. Mol. Biol. 1994, 240, 167–176. - PubMed
-
- Dill K. A. Additivity principles in biochemistry. J. Biol. Chem. 1997, 272, 701–704. - PubMed
-
- Olsson T. S. G.; Williams M. A.; Pitt W. R.; Ladbury J. E. The thermodynamics of protein−ligand interaction and solvation: insights for ligand design. J. Mol. Biol. 2008, 384, 1002–1017. - PubMed
Publication types
MeSH terms
Substances
LinkOut - more resources
Full Text Sources
Other Literature Sources
Medical
