

Downregulated expression of HSP27 in human low-grade glioma tissues discovered by a quantitative proteomic analysis
- PMID: 20346134
- PMCID: PMC2858726
- DOI: 10.1186/1477-5956-8-17
Downregulated expression of HSP27 in human low-grade glioma tissues discovered by a quantitative proteomic analysis
Abstract
Background: Heat shock proteins (HSPs), including mainly HSP110, HSP90, HSP70, HSP60 and small HSP families, are evolutionary conserved proteins involved in various cellular processes. Abnormal expression of HSPs has been detected in several tumor types, which indicates that specific HSPs have different prognostic significance for different tumors. In the current studies, the expression profiling of HSPs in human low-grade glioma tissues (HGTs) were investigated using a sensitive, accurate SILAC (stable isotope labeling with amino acids in cell culture)-based quantitative proteomic strategy.
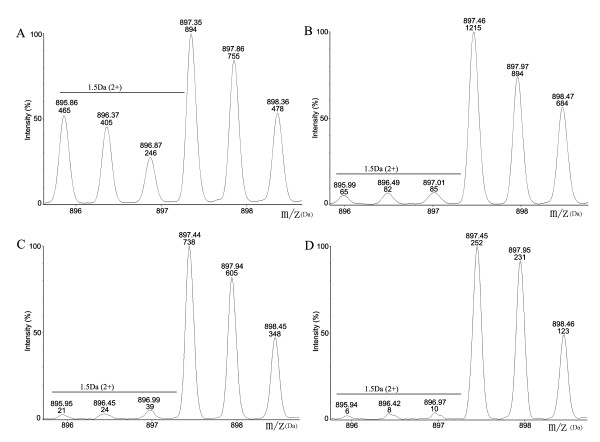
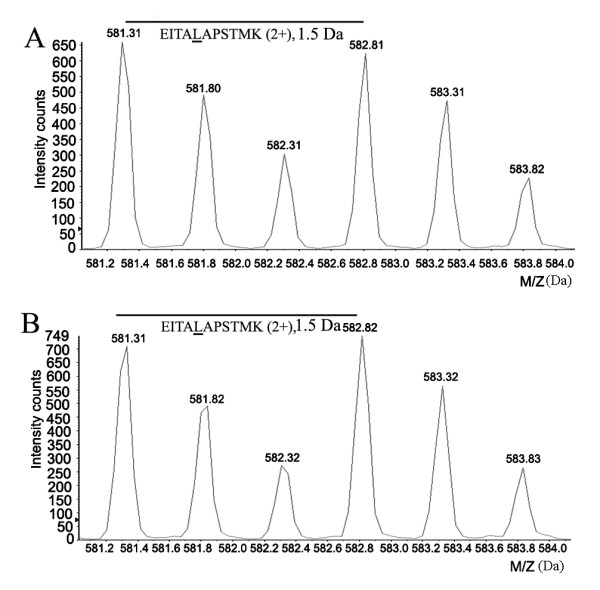
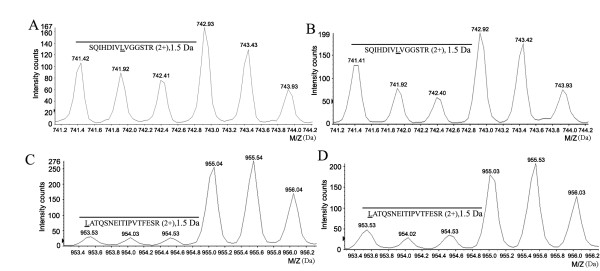
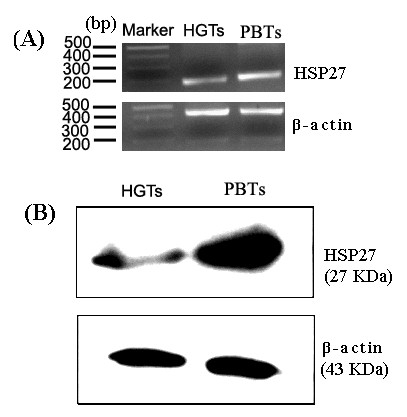
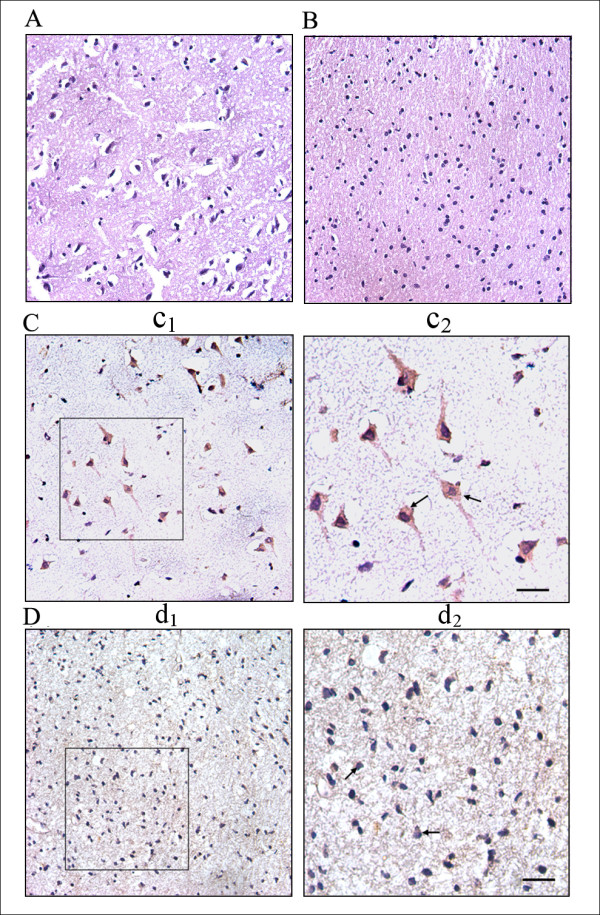
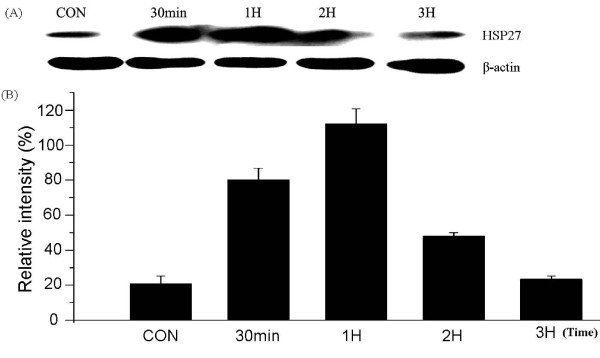
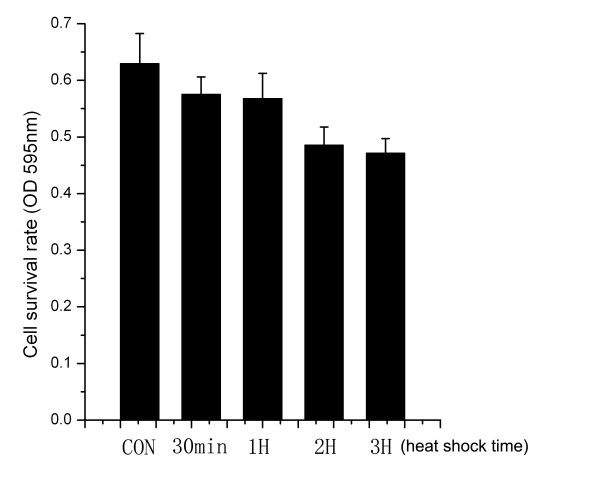
Results: The five HSP family members were detected and quantified in both HGTs and autologous para-cancerous brain tissues (PBTs) by the SILAC-based mass spectrometry (MS) simultaneously. HSP90 AB1, HSP A5(70 KDa), and especially HSP27 were significantly downregulated in HGTs, whereas the expression level of HSPA9 (70 KDa) was little higher in HGTs than that in PBTs. It was noted that the downregulation ratio of HSP27 was 0.48-fold in HGTs versus PBTs, which was further validated by results from RT-PCR, western blotting and immunohistochemistry. Furthermore, we detected HSP27 expression changes along with cell growth under heat shock treatment in glioma H4 cells.
Conclusion: The SILAC-MS technique is an applicable and efficient novel method, with a high-throughput manner, to quantitatively compare the relative expression level of HSPs in brain tumors. Different HSP family members have specific protein expression levels in human low-grade glioma discovered by SILAC-MS analysis. HSP27 expression was obviously downregulated in HGTs versus PBTs, and it exhibited temporal and spatial variation under heat shock treatment (43 degrees C/0-3 h) in vitro. HSP27's rapid upregulation was probably correlated with the temporary resistance to heat shock in order to maintain the survival of human glioma cells.
Figures
Similar articles
-
Heat shock proteins HSP27, HSP60, HSP70, and HSP90: expression in bladder carcinoma.Cancer. 2003 Sep 1;98(5):970-7. doi: 10.1002/cncr.11594. Cancer. 2003. PMID: 12942564
-
[Effect of quercetin on heat shock protein expression in HepG2 cells determined by SILAC].Zhonghua Zhong Liu Za Zhi. 2011 Oct;33(10):737-41. Zhonghua Zhong Liu Za Zhi. 2011. PMID: 22335904 Chinese.
-
Heat shock protein expression independently predicts clinical outcome in prostate cancer.Cancer Res. 2000 Dec 15;60(24):7099-105. Cancer Res. 2000. PMID: 11156417
-
Clinical, Prognostic and Therapeutic Significance of Heat Shock Proteins in Cancer.Curr Drug Targets. 2018;19(13):1478-1490. doi: 10.2174/1389450118666170823121248. Curr Drug Targets. 2018. PMID: 28831912 Review.
-
Heat Shock Proteins in Cancer Immunotherapy.J Oncol. 2019 Dec 11;2019:3267207. doi: 10.1155/2019/3267207. eCollection 2019. J Oncol. 2019. PMID: 31885572 Free PMC article. Review.
Cited by
-
Cytochrome C as a potential clinical marker for diagnosis and treatment of glioma.Front Oncol. 2022 Sep 13;12:960787. doi: 10.3389/fonc.2022.960787. eCollection 2022. Front Oncol. 2022. PMID: 36176404 Free PMC article.
-
Comparison of the expression of 5 heat shock proteins in benign and malignant salivary gland tumor tissues.Oncol Lett. 2013 Apr;5(4):1363-1369. doi: 10.3892/ol.2013.1166. Epub 2013 Jan 30. Oncol Lett. 2013. PMID: 23599795 Free PMC article.
-
Exosomal Chaperones and miRNAs in Gliomagenesis: State-of-Art and Theranostics Perspectives.Int J Mol Sci. 2018 Sep 5;19(9):2626. doi: 10.3390/ijms19092626. Int J Mol Sci. 2018. PMID: 30189598 Free PMC article. Review.
-
SAE1 promotes human glioma progression through activating AKT SUMOylation-mediated signaling pathways.Cell Commun Signal. 2019 Jul 25;17(1):82. doi: 10.1186/s12964-019-0392-9. Cell Commun Signal. 2019. PMID: 31345225 Free PMC article.
-
Proteomic analysis of cerebrospinal fluid: toward the identification of biomarkers for gliomas.Neurosurg Rev. 2014 Jul;37(3):367-80; discussion 380. doi: 10.1007/s10143-014-0539-5. Epub 2014 May 1. Neurosurg Rev. 2014. PMID: 24781189
References
-
- Schlesinger MJ. Heat shock proteins. J Biol Chem. 1990;265:12111–12114. - PubMed
LinkOut - more resources
Full Text Sources
Research Materials
Miscellaneous
