

Integrating gene expression and GO classification for PCA by preclustering
- PMID: 20346140
- PMCID: PMC2860362
- DOI: 10.1186/1471-2105-11-158
Integrating gene expression and GO classification for PCA by preclustering
Abstract
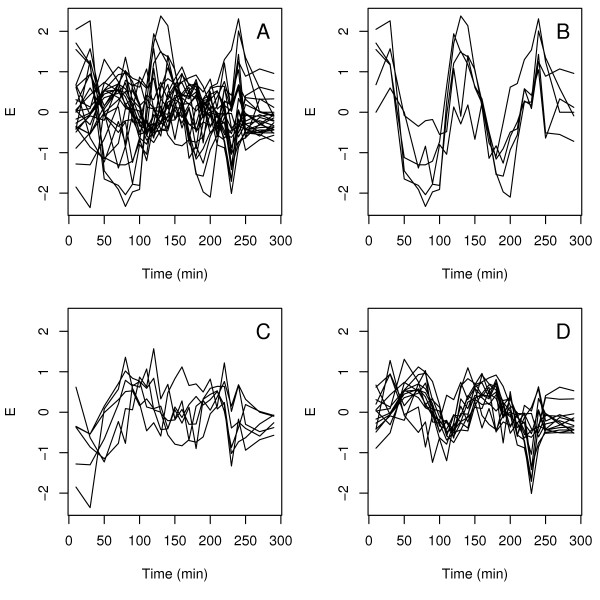
Background: Gene expression data can be analyzed by summarizing groups of individual gene expression profiles based on GO annotation information. The mean expression profile per group can then be used to identify interesting GO categories in relation to the experimental settings. However, the expression profiles present in GO classes are often heterogeneous, i.e., there are several different expression profiles within one class. As a result, important experimental findings can be obscured because the summarizing profile does not seem to be of interest. We propose to tackle this problem by finding homogeneous subclasses within GO categories: preclustering.
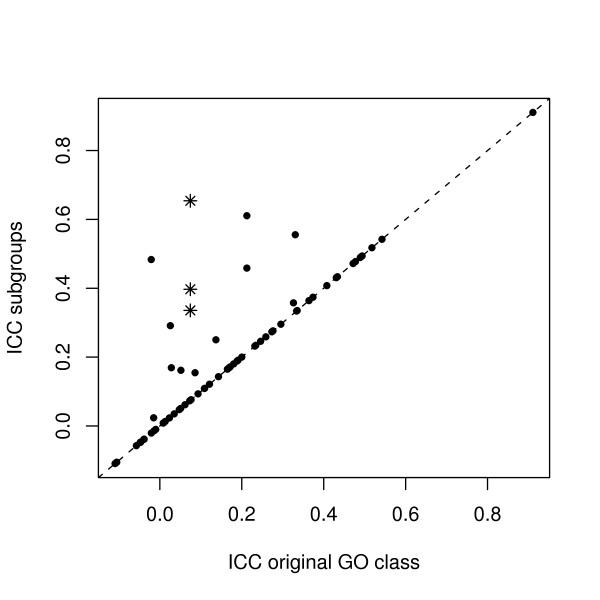
Results: Two microarray datasets are analyzed. First, a selection of genes from a well-known Saccharomyces cerevisiae dataset is used. The GO class "cell wall organization and biogenesis" is shown as a specific example. After preclustering, this term can be associated with different phases in the cell cycle, where it could not be associated with a specific phase previously. Second, a dataset of differentiation of human Mesenchymal Stem Cells (MSC) into osteoblasts is used. For this dataset results are shown in which the GO term "skeletal development" is a specific example of a heterogeneous GO class for which better associations can be made after preclustering. The Intra Cluster Correlation (ICC), a measure of cluster tightness, is applied to identify relevant clusters.
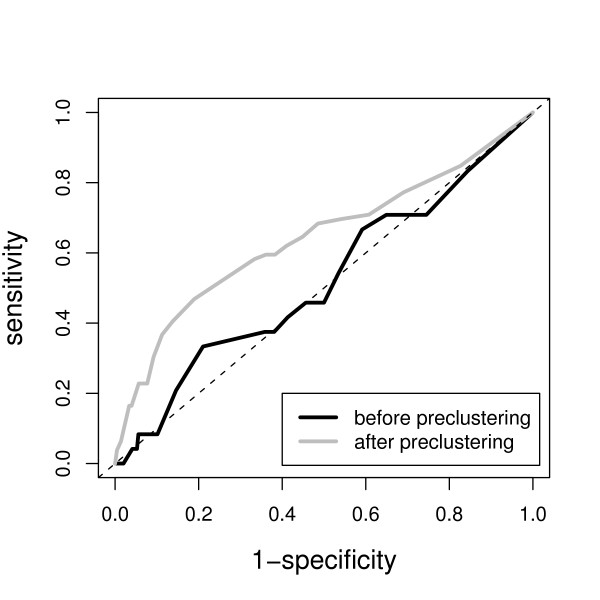
Conclusions: We show that this method leads to an improved interpretability of results in Principal Component Analysis.
Figures


Similar articles
-
Survival models with preclustered gene groups as covariates.BMC Bioinformatics. 2011 Dec 16;12:478. doi: 10.1186/1471-2105-12-478. BMC Bioinformatics. 2011. PMID: 22177110 Free PMC article.
-
Integrating biological knowledge with gene expression profiles for survival prediction of cancer.J Comput Biol. 2009 Feb;16(2):265-78. doi: 10.1089/cmb.2008.12TT. J Comput Biol. 2009. PMID: 19183004 Free PMC article.
-
Knowledge-assisted recognition of cluster boundaries in gene expression data.Artif Intell Med. 2005 Sep-Oct;35(1-2):171-83. doi: 10.1016/j.artmed.2005.02.007. Artif Intell Med. 2005. PMID: 16054350
-
Mixture models with multiple levels, with application to the analysis of multifactor gene expression data.Biostatistics. 2008 Jul;9(3):540-54. doi: 10.1093/biostatistics/kxm051. Epub 2008 Feb 5. Biostatistics. 2008. PMID: 18256042 Free PMC article.
-
[Analysis of the transcriptional regulatory network in the model organisms: yeast and sea urchin].Tanpakushitsu Kakusan Koso. 2004 Dec;49(17 Suppl):2742-50. Tanpakushitsu Kakusan Koso. 2004. PMID: 15669249 Review. Japanese. No abstract available.
Cited by
-
Genome-Wide DNA Methylation Analysis during Osteogenic Differentiation of Human Bone Marrow Mesenchymal Stem Cells.Stem Cells Int. 2018 Sep 10;2018:8238496. doi: 10.1155/2018/8238496. eCollection 2018. Stem Cells Int. 2018. PMID: 30275838 Free PMC article.
-
Rational selection of morphological phenotypic traits to extract essential similarities in chemical perturbation in the ergosterol pathway.Sci Rep. 2024 Aug 6;14(1):17093. doi: 10.1038/s41598-024-67634-1. Sci Rep. 2024. PMID: 39107358 Free PMC article.
-
Survival models with preclustered gene groups as covariates.BMC Bioinformatics. 2011 Dec 16;12:478. doi: 10.1186/1471-2105-12-478. BMC Bioinformatics. 2011. PMID: 22177110 Free PMC article.
-
Assignment of unimodal probability distribution models for quantitative morphological phenotyping.BMC Biol. 2022 Mar 31;20(1):81. doi: 10.1186/s12915-022-01283-6. BMC Biol. 2022. PMID: 35361198 Free PMC article.
-
High-dimensional single-cell phenotyping reveals extensive haploinsufficiency.PLoS Biol. 2018 May 16;16(5):e2005130. doi: 10.1371/journal.pbio.2005130. eCollection 2018 May. PLoS Biol. 2018. PMID: 29768403 Free PMC article.
References
-
- Subramanian A, Tamayo P, Mootha VK, Mukherjee S, Ebert BL, Gillette M, Paulovich A, Pomeroy S, Golub T, Lander E, Mesirov J. Gene set enrichment analysis: A knowledge-based approach for interpreting genome-wide expression profiles. Proceedings of the National Academy of Sciences. 2005;102:15545–15550. doi: 10.1073/pnas.0506580102. - DOI - PMC - PubMed
Publication types
MeSH terms
LinkOut - more resources
Full Text Sources
Molecular Biology Databases
Research Materials
