Comparative Study
. 2010;12(2):R21.
doi: 10.1186/bcr2560. Epub 2010 Mar 26.

Transcriptome analyses of mouse and human mammary cell subpopulations reveal multiple conserved genes and pathways

Affiliations
Comparative Study

Transcriptome analyses of mouse and human mammary cell subpopulations reveal multiple conserved genes and pathways

Elgene Lim et al. Breast Cancer Res. 2010.

Abstract

Introduction: Molecular characterization of the normal epithelial cell types that reside in the mammary gland is an important step toward understanding pathways that regulate self-renewal, lineage commitment, and differentiation along the hierarchy. Here we determined the gene expression signatures of four distinct subpopulations isolated from the mouse mammary gland. The epithelial cell signatures were used to interrogate mouse models of mammary tumorigenesis and to compare with their normal human counterpart subsets to identify conserved genes and networks.

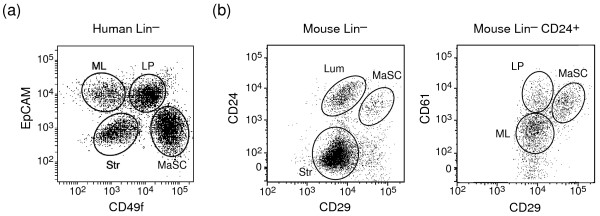
Methods: RNA was prepared from freshly sorted mouse mammary cell subpopulations (mammary stem cell (MaSC)-enriched, committed luminal progenitor, mature luminal and stromal cell) and used for gene expression profiling analysis on the Illumina platform. Gene signatures were derived and compared with those previously reported for the analogous normal human mammary cell subpopulations. The mouse and human epithelial subset signatures were then subjected to Ingenuity Pathway Analysis (IPA) to identify conserved pathways.

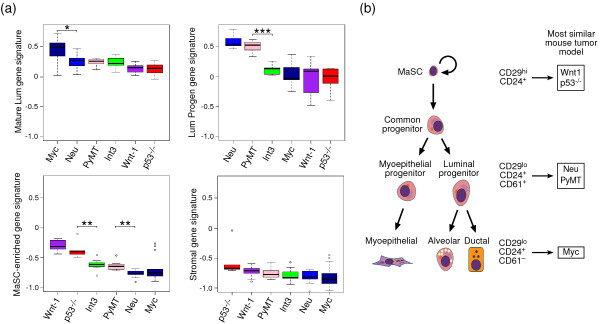
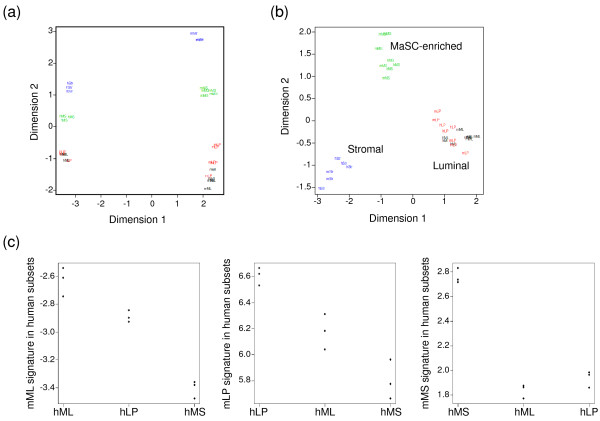
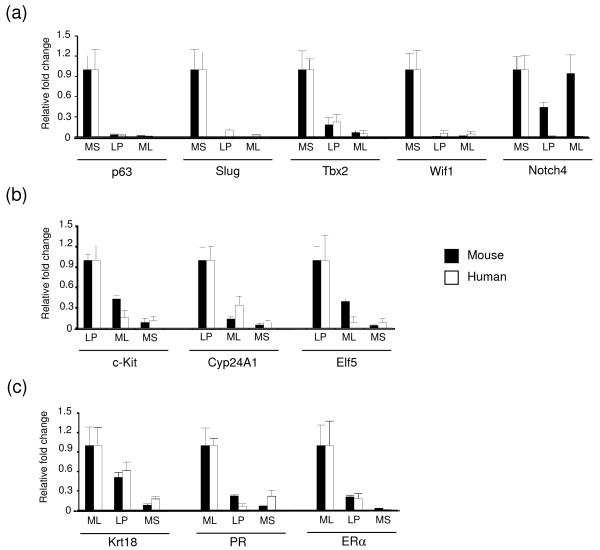
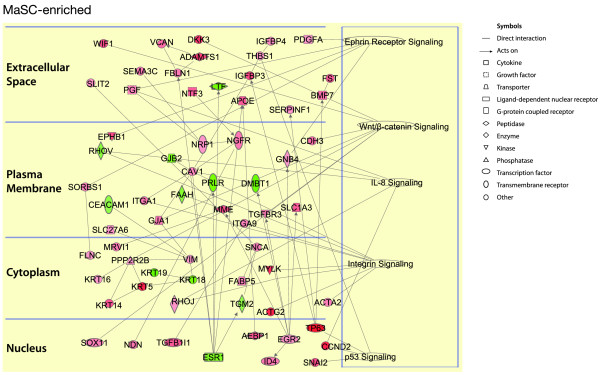
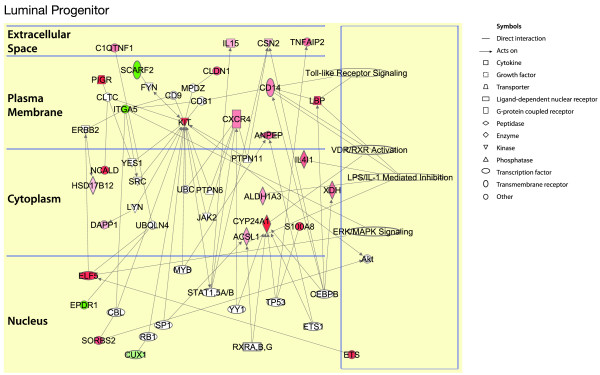
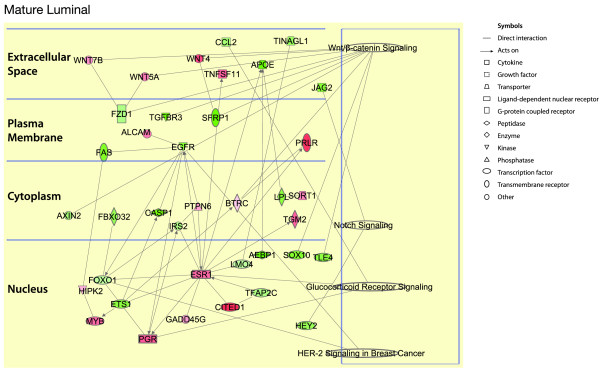
Results: The four mouse mammary cell subpopulations exhibited distinct gene signatures. Comparison of these signatures with the molecular profiles of different mouse models of mammary tumorigenesis revealed that tumors arising in MMTV-Wnt-1 and p53-/- mice were enriched for MaSC-subset genes, whereas the gene profiles of MMTV-Neu and MMTV-PyMT tumors were most concordant with the luminal progenitor cell signature. Comparison of the mouse mammary epithelial cell signatures with their human counterparts revealed substantial conservation of genes, whereas IPA highlighted a number of conserved pathways in the three epithelial subsets.

Conclusions: The conservation of genes and pathways across species further validates the use of the mouse as a model to study mammary gland development and highlights pathways that are likely to govern cell-fate decisions and differentiation. It is noteworthy that many of the conserved genes in the MaSC population have been considered as epithelial-mesenchymal transition (EMT) signature genes. Therefore, the expression of these genes in tumor cells may reflect basal epithelial cell characteristics and not necessarily cells that have undergone an EMT. Comparative analyses of normal mouse epithelial subsets with murine tumor models have implicated distinct cell types in contributing to tumorigenesis in the different models.


Figures

Figure 1
Figure 1
Comparison of analogous human and mouse mammary cell subsets. Representative FACS dotplots of (a) Lin- human mammary cells isolated from the reduction mastectomy specimen of a 27-year-old woman labeled with CD49f and EpCAM antibodies and (b) Lin- mouse mammary cells isolated from 8-week-old virgin FVB/N mice labeled with CD24, CD29, and CD61 antibodies. The four analogous mammary subsets correspond to the MaSC-enriched (human CD49fhiEpCAM-; mouse CD29hiCD24+CD61+), luminal progenitor (human CD49f+EpCAM+; mouse CD29loCD24+CD61+), mature luminal (human CD49f-EpCAM+; mouse CD29loCD24+CD61-), and stromal (human CD49f-EpCAM-; mouse CD29loCD24-) mammary cell subpopulations. LP: luminal progenitor; Lum: luminal; ML: mature luminal; MS: MaSC-enriched; Str: stromal.
Figure 2
Figure 2
Comparison of gene expression profiles of normal mouse mammary cell subsets with mammary tumor models. (a) Box plots of signature expression scores by the mouse mammary tumor model for each subset. The MaSC-enriched signature scores are highest in the MMTV-Wnt-1 and p53-/- tumors, whereas the luminal progenitor signature scores are highest in the MMTV-Neu and MMTV-PyMT models. *P < 0.05, **P < 0.01, ***P < 0.001. Mammary tumor datasets are from Herschkowitz et al. [14]. (b) Schematic model of the mouse mammary epithelial hierarchy and possible relations with mouse mammary tumor models. Subpopulations containing MaSCs, luminal progenitor, and mature luminal cells are defined by differential expression of CD24, CD29, and CD61. Gene expression profiling of these subpopulations revealed similarities to specific mouse mammary tumor models, depicted on the right side.
Figure 3
Figure 3
Colocalization of gene signatures of corresponding human and mouse mammary cell subsets. (a) Multidimension scaling (MDS) plot showing clear separation of the MaSC-enriched (MS), the two luminal (luminal progenitor, LP; and mature luminal, ML), and stromal (str) cell subpopulations in both human (h) and mouse (m) mammary glands. (b) MDS plot after normalization for dimension 1 in (a), representing the differences across species. This demonstrates colocalization of analogous human and mouse mammary cell subsets. (c) Dot plots demonstrating the highest colocalization of gene signatures between corresponding subsets compared with other subsets.
Figure 4
Figure 4
Quantitative RT-PCR analysis of specific genes that define human and mouse mammary epithelial subsets. Histograms depicting the relative fold difference in RNA expression between specific mammary epithelial cell subsets relative to other subsets in mouse and human mammary tissue. Expression analysis was relative to 18S rRNA. Examples of genes primarily expressed in the (a) MaSC-enriched subset, (b) luminal progenitor subset, and (c) mature luminal subset. At least three independent samples from either mouse or human mammary cell populations were evaluated for each gene. Data represent mean ± SEM. Statistically significant differences of P < 0.05 (t test) were observed between expression in the basal (MS) versus the two luminal subpopulations (ML and PL) for all genes except mouse Notch4.
Figure 5
Figure 5
Conserved genes and pathways across the human and mouse mammary stem cell-enriched subsets. Ingenuity pathway analysis of conserved genes between mouse and human, and mouse genes with human orthologues, in the MaSC-enriched subset. The genes are divided according to the cellular distribution of the proteins for which they encode. The active pathways in each subset are represented on the right. Red represents upregulated genes, whereas green depicts downregulated genes. White symbols depict neighboring genes. The intensity of color represents the average log fold-change in a given population relative to the other epithelial subsets.
Figure 6
Figure 6
Conserved genes and pathways across the human and mouse luminal progenitor cell subsets. Ingenuity pathway analysis of conserved genes between mouse and human, and mouse genes with human orthologues, in the luminal progenitor subset. The genes are divided according to the cellular distribution of the proteins for which they encode. The active pathways in each subset are represented on the right. Red represents upregulated genes, whereas green depicts downregulated genes. White symbols depict neighboring genes. The intensity of color represents the average log fold-change in a given population relative to the other epithelial subsets.
Figure 7
Figure 7
Conserved genes and pathways across the human and mouse mature luminal cell subsets. Ingenuity pathway analysis of conserved genes between mouse and human, and mouse genes with human orthologues, in the mature luminal epithelial cell subset. The genes are divided according to the cellular distribution of the proteins for which they encode. The active pathways in each subset are represented on the right. Red represents upregulated genes, whereas green depicts downregulated genes. White symbols depict neighboring genes. The intensity of color represents the average log fold-change in a given population relative to the other epithelial subsets.

Comment in

  • Breast tumors: of mice and women.
    McDermott SP, Wicha MS. McDermott SP, et al. Breast Cancer Res. 2010;12(3):108. doi: 10.1186/bcr2569. Epub 2010 May 27. Breast Cancer Res. 2010. PMID: 20550730 Free PMC article.

References

    1. Visvader JE. Keeping abreast of the mammary epithelial hierarchy and breast tumorigenesis. Genes Dev. 2009;23:2563–2577. doi: 10.1101/gad.1849509. - DOI - PMC - PubMed
    1. Asselin-Labat ML, Sutherland KD, Barker H, Thomas R, Shackleton M, Forrest NC, Hartley L, Robb L, Grosveld FG, Wees J van der, Lindeman GJ, Visvader JE. Gata-3 is an essential regulator of mammary-gland morphogenesis and luminal-cell differentiation. Nat Cell Biol. 2007;9:201–209. doi: 10.1038/ncb1530. - DOI - PubMed
    1. Shackleton M, Vaillant F, Simpson KJ, Stingl J, Smyth GK, Asselin-Labat ML, Wu L, Lindeman GJ, Visvader JE. Generation of a functional mammary gland from a single stem cell. Nature. 2006;439:84–88. doi: 10.1038/nature04372. - DOI - PubMed
    1. Sleeman KE, Kendrick H, Ashworth A, Isacke CM, Smalley MJ. CD24 staining of mouse mammary gland cells defines luminal epithelial, myoepithelial/basal and non-epithelial cells. Breast Cancer Res. 2006;8:R7. doi: 10.1186/bcr1371. - DOI - PMC - PubMed
    1. Stingl J, Eirew P, Ricketson I, Shackleton M, Vaillant F, Choi D, Li HI, Eaves CJ. Purification and unique properties of mammary epithelial stem cells. Nature. 2006;439:993–997. - PubMed

Publication types

MeSH terms

Associated data