Comparative Study
. 2010 Mar 25;65(6):927-39.
doi: 10.1016/j.neuron.2010.02.027.

Separable learning systems in the macaque brain and the role of orbitofrontal cortex in contingent learning

Affiliations
Comparative Study

Separable learning systems in the macaque brain and the role of orbitofrontal cortex in contingent learning

Mark E Walton et al. Neuron. .

Abstract

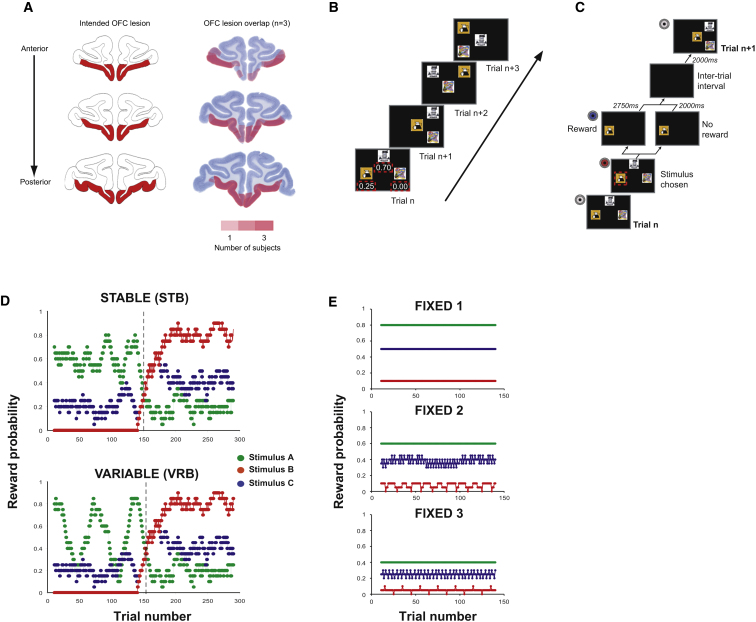
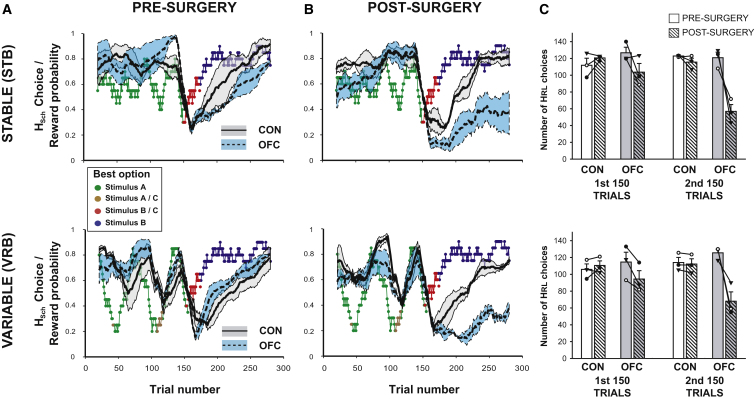
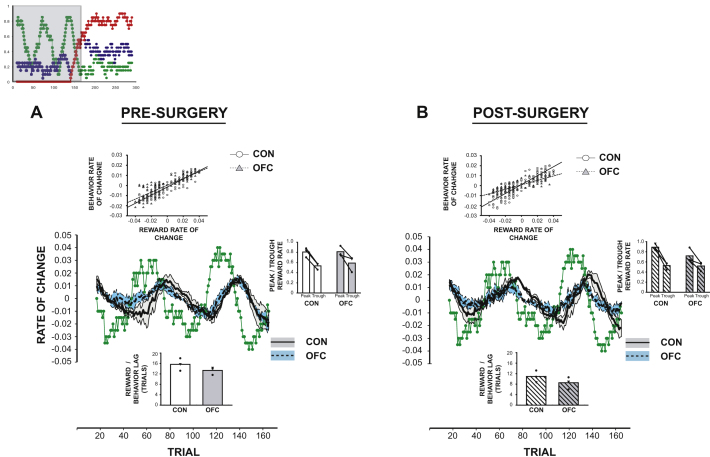
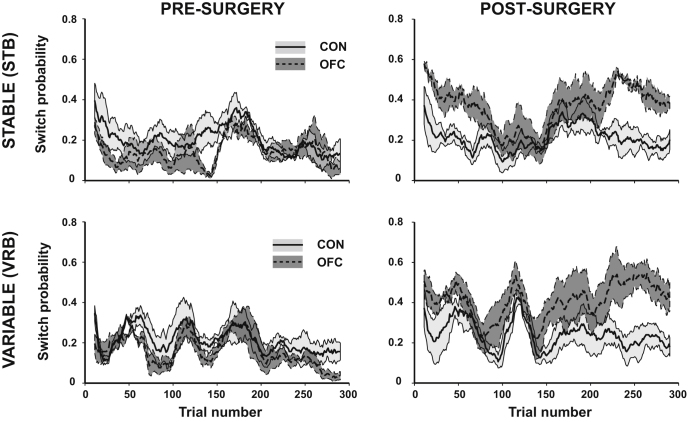
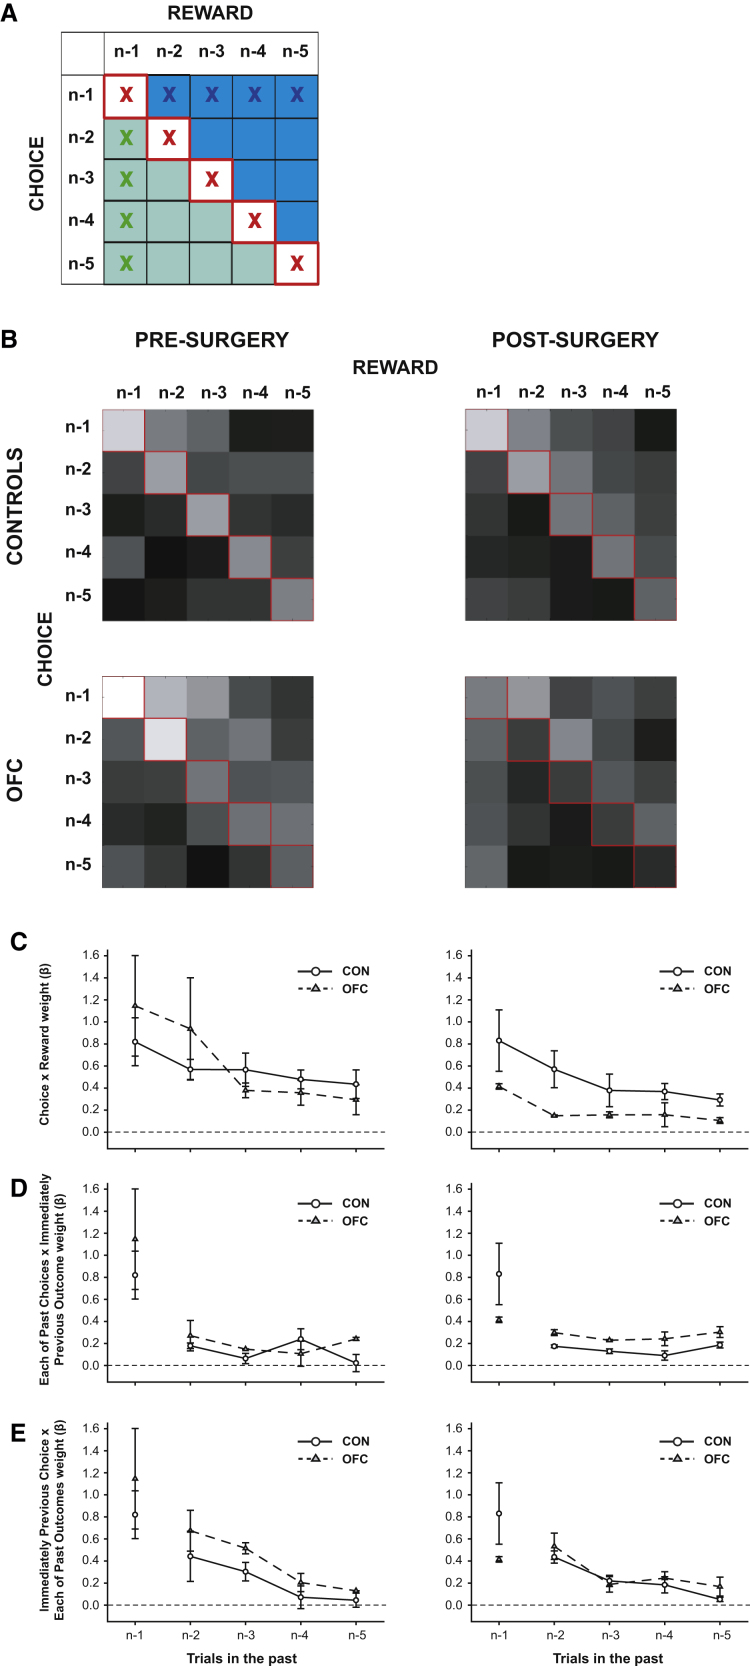
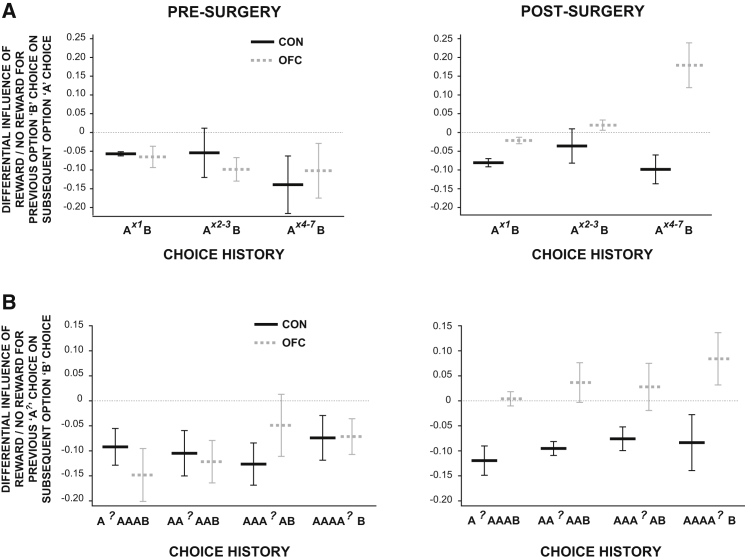
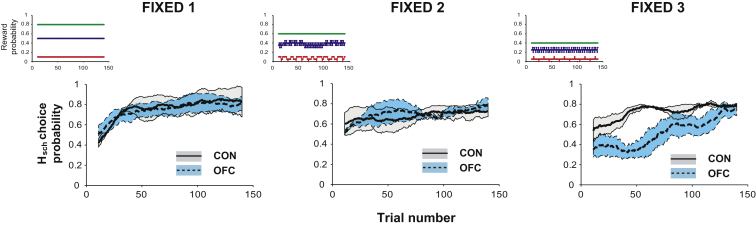
Orbitofrontal cortex (OFC) is widely held to be critical for flexibility in decision-making when established choice values change. OFC's role in such decision making was investigated in macaques performing dynamically changing three-armed bandit tasks. After selective OFC lesions, animals were impaired at discovering the identity of the highest value stimulus following reversals. However, this was not caused either by diminished behavioral flexibility or by insensitivity to reinforcement changes, but instead by paradoxical increases in switching between all stimuli. This pattern of choice behavior could be explained by a causal role for OFC in appropriate contingent learning, the process by which causal responsibility for a particular reward is assigned to a particular choice. After OFC lesions, animals' choice behavior no longer reflected the history of precise conjoint relationships between particular choices and particular rewards. Nonetheless, OFC-lesioned animals could still approximate choice-outcome associations using a recency-weighted history of choices and rewards.


Figures

Figure 1
Figure 1
OFC Lesion Location and Task Schematic (A) Diagram of intended (left) and actual (right) OFC lesion locations. Redness of shading on the actual lesion diagram represents the number of animals (1–3) showing overlap at each location. (B and C) Schematic of trial-by-trial (B) and within-trial (C) task structure. On each trial, monkeys were presented with three clipart stimuli in one of four possible locations on a touchscreen (trials n to n+4). Each stimulus was associated with different outcome probabilities (example probabilities in red dashed boxes on trial n are shown for illustrative purposes only). On each trial, selecting one stimulus caused the other two options to extinguish and reward to be delivered according to the reward schedule. Gray, blue, and red circles = different 250 ms tones. (D and E) Predetermined reward schedules used in the changeable (D) and fixed (E) conditions. The schedules determined whether or not reward was delivered for selecting a stimulus (stimulus A–C) on a particular trial. Dashed black lines in (D) represent the reversal point in the schedule when the identity of the highest value stimulus changes.
Figure 2
Figure 2
Likelihood of Choosing Hsch in STB (Upper Panels) and VRB (Lower Panels) (A and B) Average pre- (A) and postsurgery (B) choice behavior in the control (solid black line) and OFC groups (dashed black line). SEMs are filled gray and blue areas respectively for the two groups. Colored points represent the reward probability and identity of Hsch (stimulus A–C). (C) Average number of choices during the first or second 150 trials that were congruent with HRL (the subjectively highest value option as defined by a reinforcement learning model). Controls, white bars; OFCs, gray bars. Symbols and connecting lines represent data for individual animals.
Figure 3
Figure 3
Tracking Value during the First 150 Trials of the Variable Schedule Responsiveness of choice behavior to changes in reward likelihood of the highest value stimulus during the first 150 trials of VRB schedule (shaded area in upper inset) both before (A) and after (B) surgery. Main figure depicts rate of change of reward likelihood (green points) along with rate of change of behavior in controls (solid black line; gray shading = SEM) and OFCs (dashed black line; blue shading = SEM). Inset graphs show the average peak and lowest rates of choosing the highest value stimulus (right panel), the lag between changes in reward likelihood and behavior (lower panel), and the relationship between the rate of change of reward likelihood and of delagged choice behavior (upper panel). Controls, white bars; OFCs, gray bars.
Figure 4
Figure 4
Rates of Switching Behavior during the Changeable Schedules Pre- and postsurgery average trial-by-trial switching likelihood across STB and VRB in control (solid black line, light gray shading = SEM) and OFC (dashed black line; dark gray shading = SEM) animals. See also Figure S1.
Figure 5
Figure 5
Influence of Recent Choices and Recent Outcomes on Current Behavior (A) Matrix of components included in logistic regression. Red (i), green (ii), and blue (iii) X's respectively mark elements representing the influence of: (i) recent choices and their specific outcomes; (ii) the previous choice and each recent past outcome, and (iii) the previous outcome and each recent past choice, on current behavior. Green area represents influence of associations between choices and rewards received in the past; blue area represents the influence of associations between past rewards and choices made in the subsequent trials. (B) Regression weights for this matrix for each group pre- and postoperatively, log-transformed for ease of visualization (bright pixels = larger regression weights). (C–E) Plots of influence of X-marked components in (A). The data for the first trial in the past in (C)–(E) are identical. Symbols and bars show mean and SEM values for controls (black circles, solid black lines) and OFCs (gray triangles, dashed gray lines). See also Figures S2 and S3.
Figure 6
Figure 6
Influence of Past Choices (A) and Rewards (B) on Current Choice in Changeable Three-Armed Bandit Tasks (A) Difference in likelihood of choosing option A on trial n after previously selecting option B on trial n-1 as a function of whether or not reward was received for this choice. Data is plotted based on the length of choice history on A (1 previous choice of A, left plots; 2–3 previous choices of A, middle plots; 4–7 previous choices of A, right plots). See also Figure S4. (B) Difference in likelihood of choosing option B on trial n after previously selecting option A on trials n-2 to n-5 and option B on the previous trial (n-1), as a function of whether a particular previous A choice (A?) was or was not rewarded. Bars show mean and SEM values for controls (solid black lines) and OFCs (dashed gray lines). See also Figure S5.
Figure 7
Figure 7
Likelihood of Choosing Hsch in the Fixed Three-Armed Bandit Schedules Controls, solid black lines (gray shading = SEM); OFCs, dashed gray lines (blue shading = SEM). Inset panels depict each predetermined reward schedule.

Comment in

References

    1. Balleine B.W., Dickinson A. Goal-directed instrumental action: contingency and incentive learning and their cortical substrates. Neuropharmacology. 1998;37:407–419. - PubMed
    1. Barraclough D.J., Conroy M.L., Lee D. Prefrontal cortex and decision making in a mixed-strategy game. Nat. Neurosci. 2004;7:404–410. - PubMed
    1. Behrens T.E., Woolrich M.W., Walton M.E., Rushworth M.F. Learning the value of information in an uncertain world. Nat. Neurosci. 2007;10:1214–1221. - PubMed
    1. Bogacz R., McClure S.M., Li J., Cohen J.D., Montague P.R. Short-term memory traces for action bias in human reinforcement learning. Brain Res. 2007;1153:111–121. - PubMed
    1. Butter C.M. Perseveration in extinction and in discrimination reversal tasks following selective prefrontal ablations in Macaca mulatta. Physiol. Behav. 1969;4:163–171.

Publication types