. 2010 Mar 26;32(3):342-54.
doi: 10.1016/j.immuni.2010.03.006.

CD45-Csk phosphatase-kinase titration uncouples basal and inducible T cell receptor signaling during thymic development

Affiliations

CD45-Csk phosphatase-kinase titration uncouples basal and inducible T cell receptor signaling during thymic development

Julie Zikherman et al. Immunity. .

Abstract

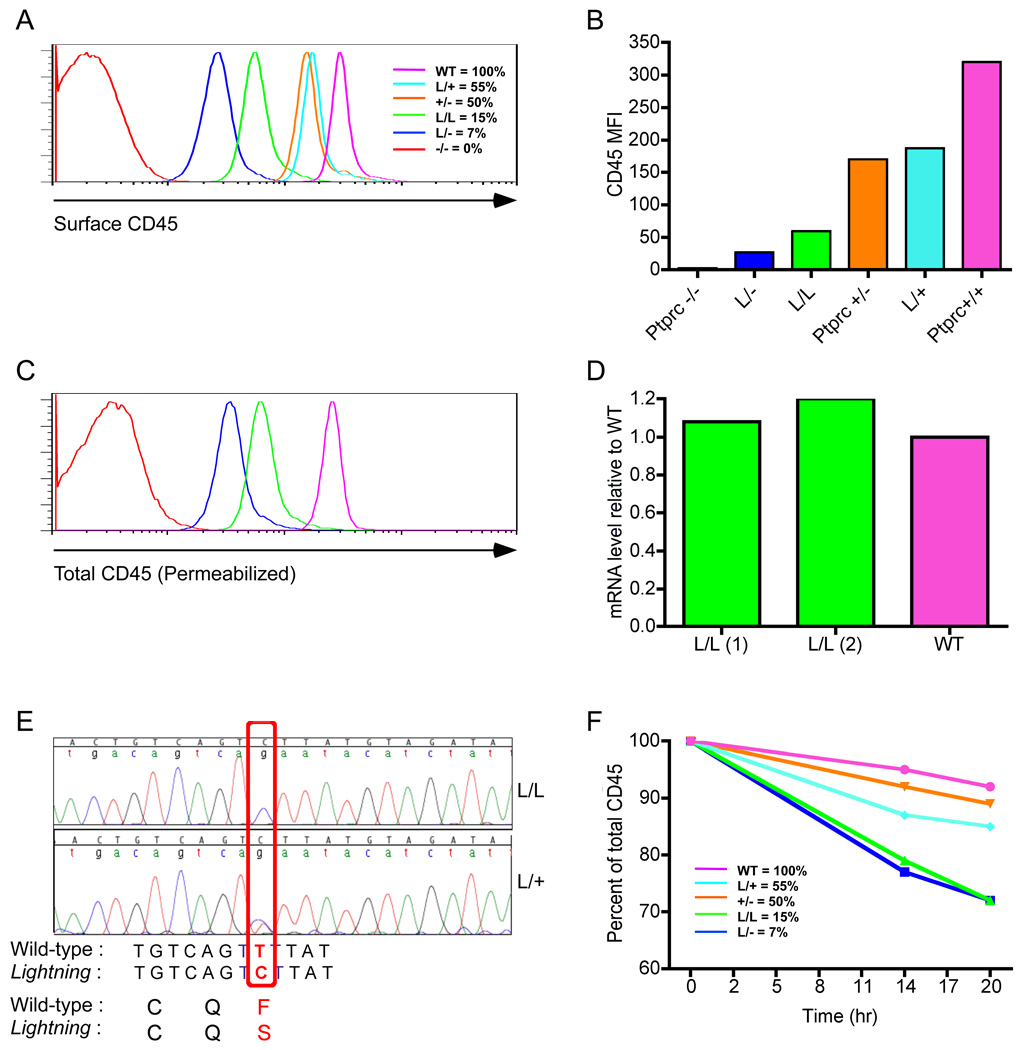
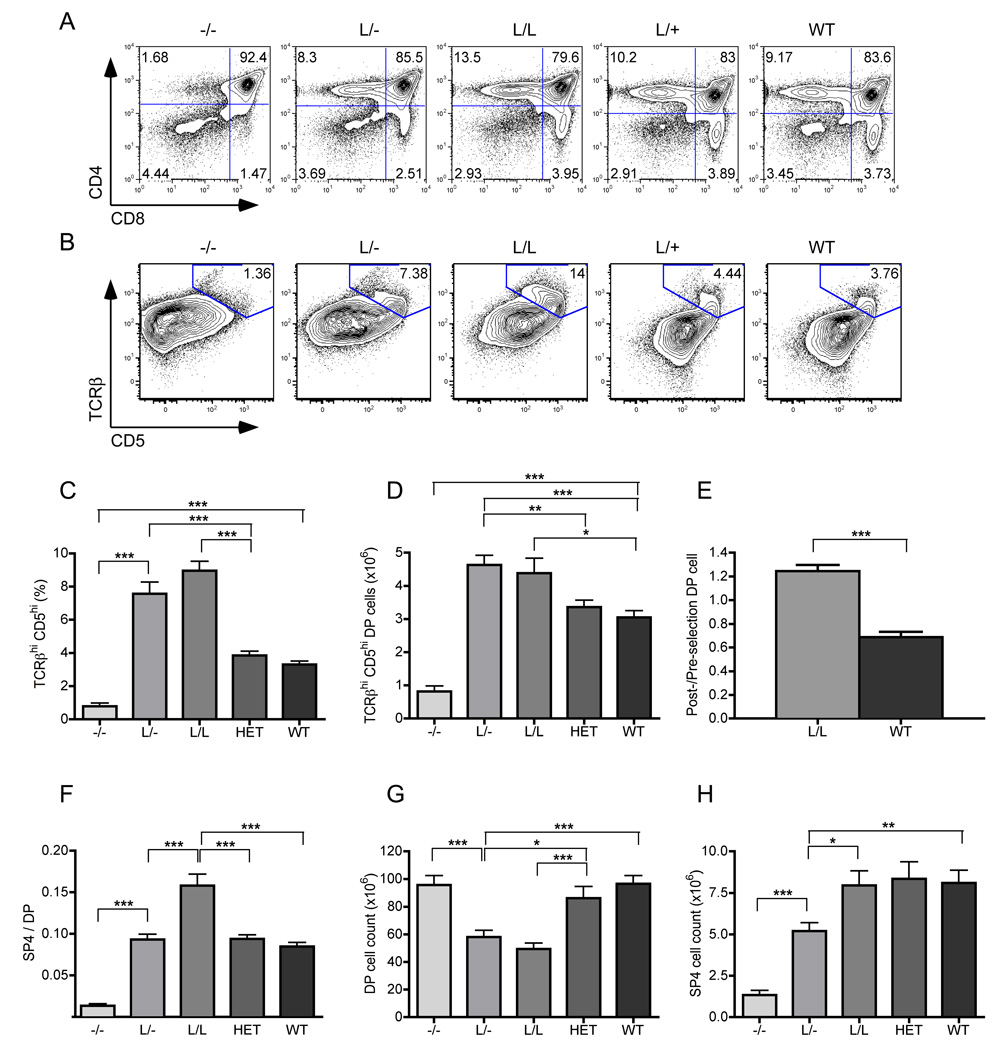
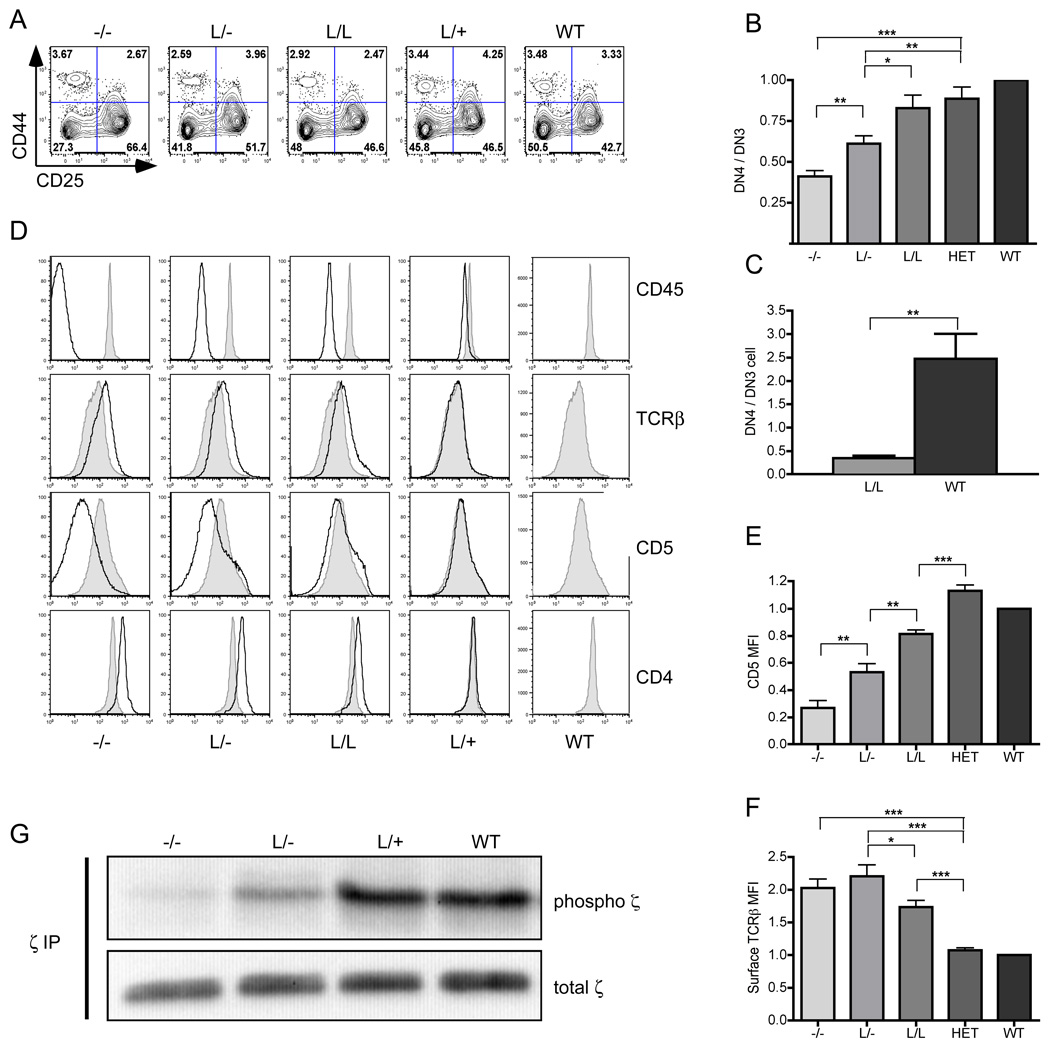
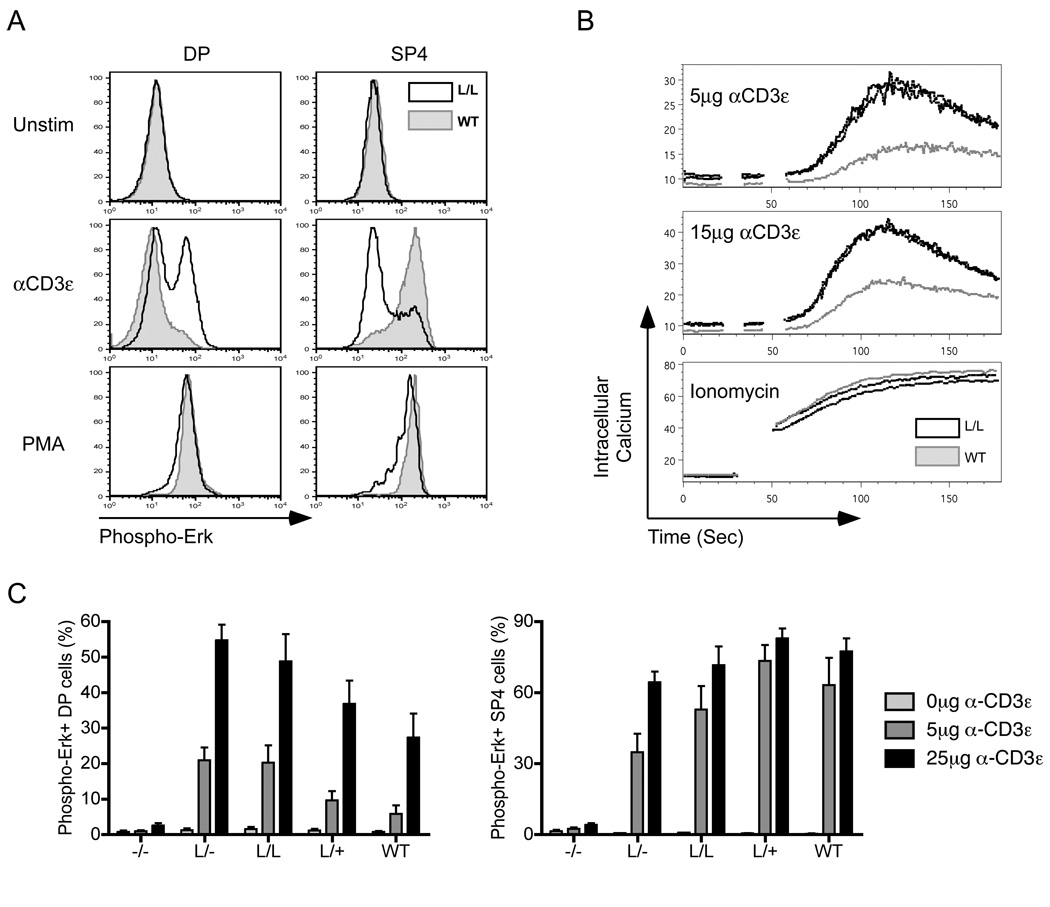
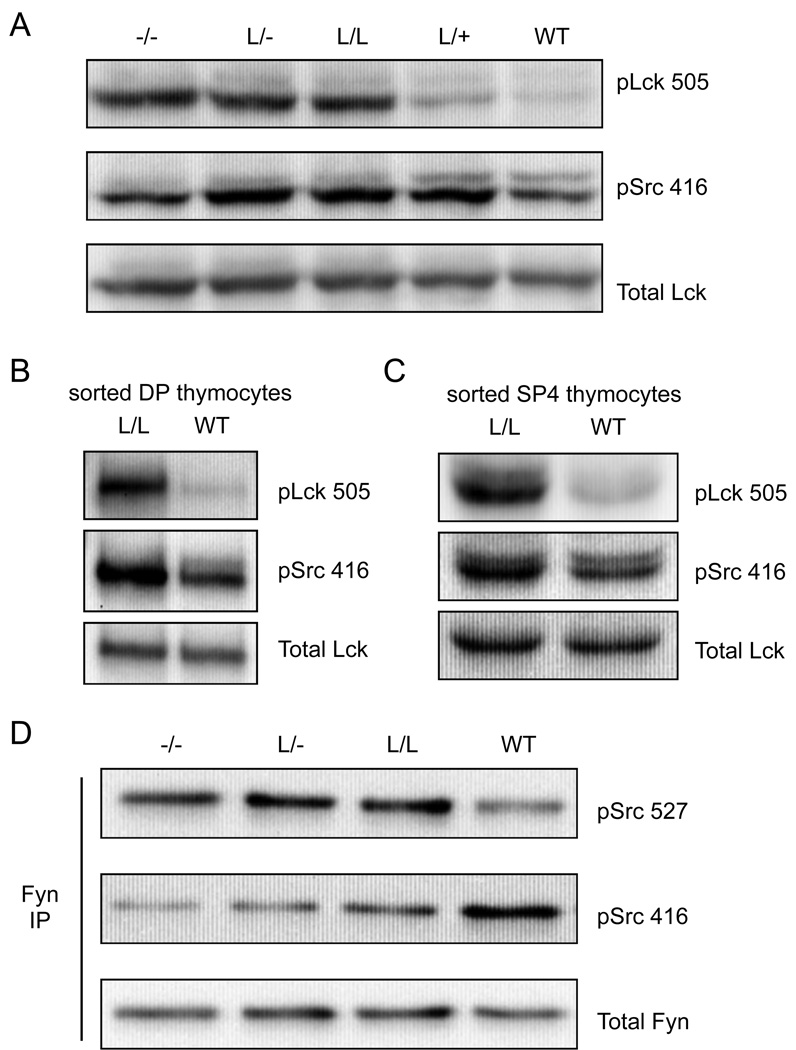
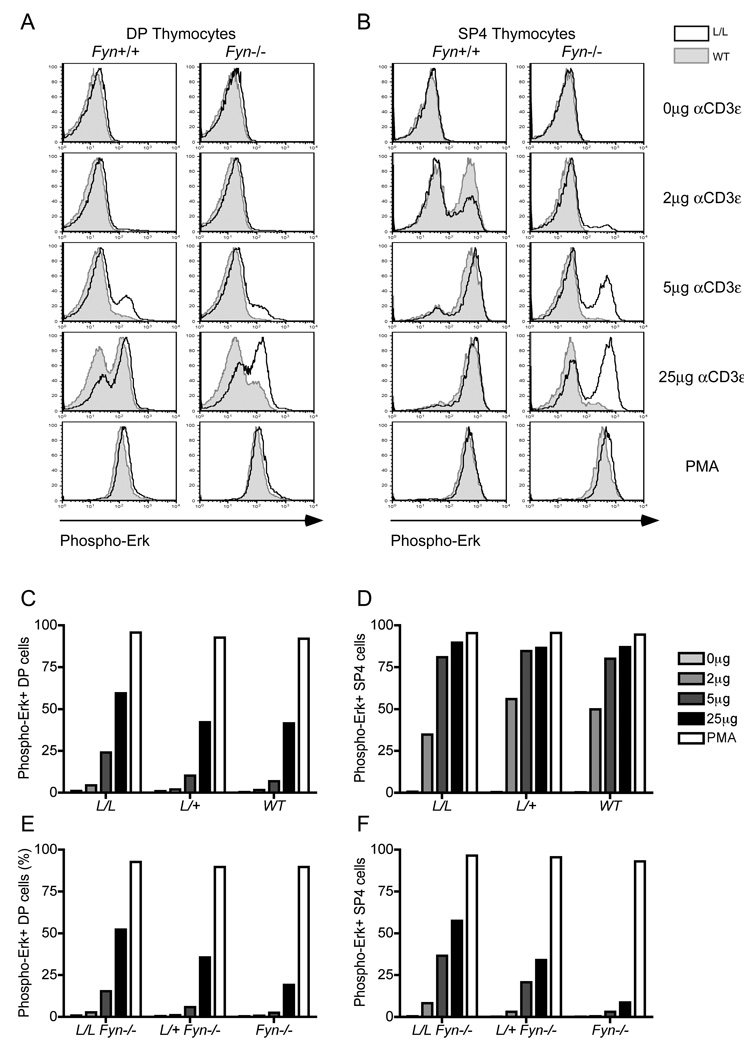
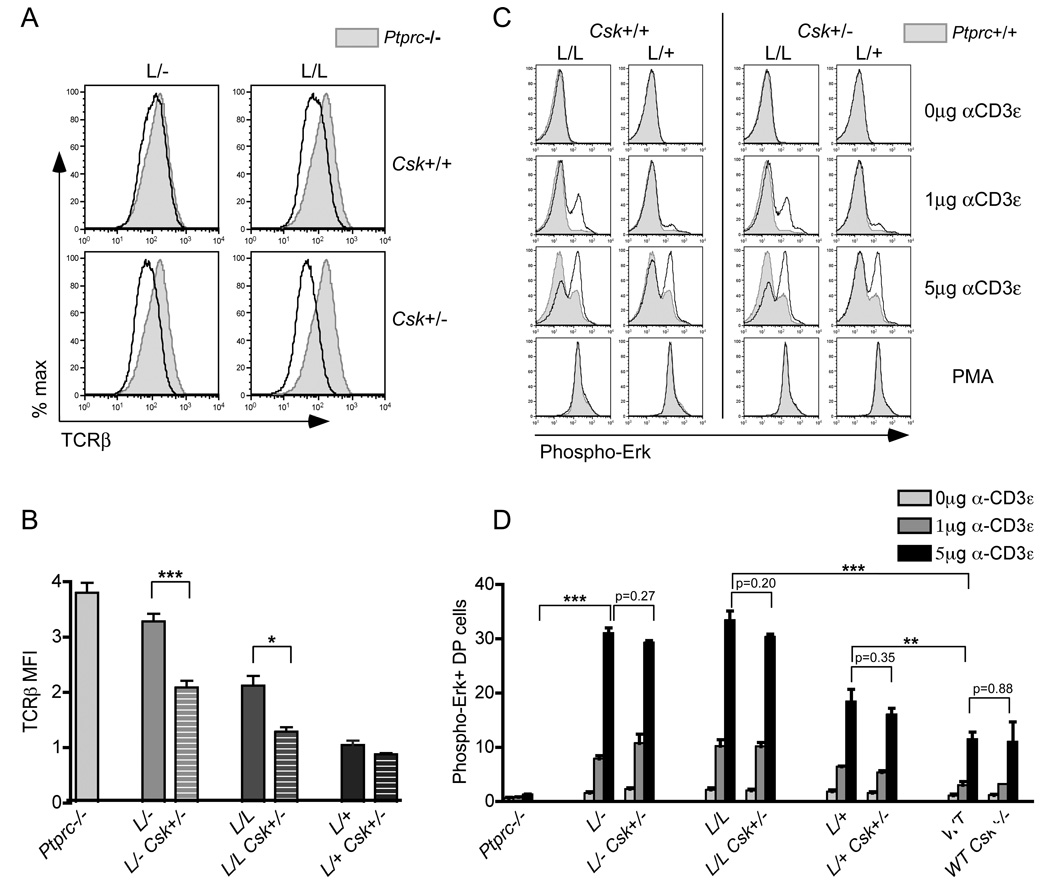
The kinase-phosphatase pair Csk and CD45 reciprocally regulate phosphorylation of the inhibitory tyrosine of the Src family kinases Lck and Fyn. T cell receptor (TCR) signaling and thymic development require CD45 expression but proceed constitutively in the absence of Csk. Here, we show that relative titration of CD45 and Csk expression reveals distinct regulation of basal and inducible TCR signaling during thymic development. Low CD45 expression is sufficient to rescue inducible TCR signaling and positive selection, whereas high expression is required to reconstitute basal TCR signaling and beta selection. CD45 has a dual positive and negative regulatory role during inducible but not basal TCR signaling. By contrast, Csk titration regulates basal but not inducible signaling. High physiologic expression of CD45 is thus required for two reasons-to downmodulate inducible TCR signaling during positive selection and to counteract Csk during basal TCR signaling.


Figures

Figure 1
Figure 1. A single Phe to Ser substitution in an extracellular fibronectin repeat of the CD45 lightning allele reduces protein half-life
(A and B) DP thymocytes from an allelic series of mice generated by crossing wild-type, lightning, and Ptprc null alleles were stained for surface CD45 and assessed by flow cytometry. Representative histograms as well as CD45 MFI (mean fluorescence intensity) are plotted. (Genotypes in all figures : −/− = Ptprc−/−; WT = Ptprc+/+; L= Lightning allele) (C) DP thymocytes from allelic series were permeabilized, stained for CD45, and assessed by flow cytometry. Representative histograms are plotted. (D) Quantitiative real time PCR of Ptprc cDNA from two L/L and one wild-type thymi are normalized to GAPDH. Transcript amounts are expressed in relative units (wild-type CD45 = 1). Data are the average of three technical replicates. (E) Sequencing of PCR-amplified Ptprc cDNA fragments from L/L and L/+ thymi. Sequence flanking mutated residue F503 is shown. (H) Allelic series thymocytes incubated with CHX for varying time points. Flow cytometric assessment of permeabilized, stained cells for total CD454 protein content plotted with respect to baseline levels. Results are representative of three independent experiments.
Figure 2
Figure 2. Dual positive and negative regulatory roles for CD45 during positive selection
(A) Representative plots of allelic series thymocytes co-stained for CD4 and CD8 to identify DN, DP, and SP subsets. (B) Representative plots of allelic series DP thymocytes co-stained for TCRβ and CD5. Gating to identify post-selection thymocytes (TCRβhi CD5hi) is based upon the developmental block in Ptprc−/− thymocytes. (C and D) Quantification of relative and absolute number of TCRβhi CD5hi post-selection DP thymocytes as gated in D. Values are the mean of ten biological replicates +/− SEM. (E) 1:1 competitive chimeras were generated with L/L and WT donor bone marrow. Thymi were stained for pre- and post-selection DP thymocytes using CD4, CD8, TCRβ, CD5 as well as 45.1 and 45.2 allotype markers. Bar graphs represent ratio of post-selection/pre-selection DP subsets. Data are normalized to a 1:1 input ratio at the pre-selection DP subset. Values in the graphs are the mean of 5 biological replicates +/−SEM. (F) Quantification of SP4 / DP ratios from allelic series thymi as stained and gated in A. (G) Quantification of absolute DP cell counts from allelic series thymi as stained and gated in A. (H) Quantification of absolute SP4 cell counts from allelic series thymi as stained and gated in A. Values in F, G, and H are the mean of ten biological replicates +/− SEM. In this and all subsequent figures, “HET” refers to both L/+ and Ptprc+/− genotype. In this and all subsequent figures statistical analysis using unpaired t-tests was performed. P<0.05 = *; p<0.005 =**; p<0.0005 = ***
Figure 3
Figure 3. High CD45 expression is required to rescue beta selection and basal signaling during thymic development
(A) Representative plots of allelic series DN thymocytes (dump staining for CD4, CD8, CD3, CD19, γδ, NK1.1, pNK, CD11b, CD11c, Gr1 was performed to remove contaminating cell lineages from the gate) stained with CD44 and CD25 to identify subsets DN 1–4 (clockwise from top left). DN3 gate is CD44CD25+ and DN4 gate is CD44CD25. (B) Quantification of DN4 / DN3 ratios from allelic series thymi as stained and gated in A. Values are the mean of six biological replicates +/− SEM, normalized to wild-type. (C) 1:1 competitive chimeras were generated with L/L and WT donor bone marrow. Thymi were stained for DN3 and DN4 subsets using method outlined in 3A, as well as 45.1 and 45.2 allotype markers. Bar graphs represent ratio of DN4/DN3 subsets. Data are normalized to a 1:1 input ratio at the DN3 subset. Values in the graphs are the mean of three biological replicates +/− SEM. (D) Representative histograms of surface marker expression on unstimulated DP thymocytes from the allelic series. Experimental samples from the allelic series (black histogram) are each overlayed upon wild-type (gray shaded histogram) for comparison. (E and F) Quantification of MFI of CD5 and TCRβ surface levels respectively from preselection DP thymocytes as gated in Supp. Figure 2. Values are the mean of six biological replicates +/− SEM, normalized to wild-type. (G) TCR-associated ζ chain was immunoprecipitated from whole cell lysates of resting allelic series thymi. Immunoprecipitates (IPs) were subsequently blotted for total ζ and total phosphotyrosine levels. p21 ζ is depicted. Blots are representative of three independent experiments.
Figure 4
Figure 4. Differential influence of CD45 expression on inducible TCR signaling in DP and SP thymocytes
(A) Stimulated, fixed, and permeabilized thymocytes were stained for phospho-Erk and co-stained for CD4 and CD8 to identify DP and SP subsets. Data was collected by flow cytometry. Histograms depict intra-cellular phospho-Erk in DP and SP subsets from wild-type (gray shaded histogram) and L/L (black line) thymi. Data are representative of at least 8 independent experiments. (B) Intracellular calcium was assessed by flow cytometry over time in Fluo-4 loaded thymocytes after TCR or ionomycin stimulation. DP thymocytes were gated by size. (C) Allelic series thymocytes were stimulated and stained for intra-cellular phospho-Erk, CD4, and CD8 as described in A. Quantification of cells which fall into the positive half of a bimodal phospho-Erk distribution (as depicted in A). PMA stimulation produced identical upregulation of Erk phosphorylation in all genotypes (data not shown). Values are the mean of three independent experiments +/− SEM.
Figure 5
Figure 5. CD45 differentially controls Lck and Fyn regulatory tyrosine phosphorylation
(A) Whole cell lysates of resting allelic series thymocytes were blotted with Ab to the inhibitory and activating tyrosine of Lck (Lck505 / Src416). Src416 Ab binds activating tyrosines of all SFKs; lower band represents p56 Lck and the upper band represents p59 Fyn. Total Lck is stained as a loading control. (B, C) Whole cell lysates of purified DP (C) or SP4 (D) thymocytes from L/L and WT mice were blotted with Ab as described in (A). (D) Fyn IPs from whole cell lysates of resting allelic series thymocytes were blotted with Ab to the inhibitory and activating tyrosines of Fyn (Src 527 / Src 416). Total Fyn was stained as a loading control. Blots in this figure are representative of at least three independent experiments.
Figure 6
Figure 6. Fyn accounts for differential regulation of inducible TCR signaling by CD45 in DP and SP4 thymic subsets
(A, B) Histograms depict intra-cellular phospho-Erk in TCR-stimulated DP and SP subsets from L/L (black line) or Ptprc+/+ (gray shaded histogram) mice on either a Fyn+/+ or Fyn−/− genetic background. (C-F) Graphs represent quantification of data from (A, B) along with the addition of L/+ Fyn+/+ and L/+ Fyn−/− mice. Data in Figure 6 are representative of 2 independent experiments.
Figure 7
Figure 7. Csk dose reduction uncouples basal and inducible signaling during thymic development
(A) Representative histograms of TCRβ expression on pre-selection DP thymocytes from L/− and L/L mice on either a Csk+/+ or Csk+/− genetic background (black line). Ptprc−/− Csk+/+ sample (gray shaded histogram) is plotted for reference. (B) Quantification of data presented in (A) along with the addition of L/+ Csk+/+ and L/+ Csk+/− mice. Values are the mean of at least three independent experiments +/− SEM, normalized to wild-type. (C) Histograms depict intra-cellular phospho-Erk in TCR-stimulated DP subsets from L/L or L/+ mice on either a Csk+/+ or Csk+/− genetic background (black line). Ptprc+/+ Csk+/+ wild type samples (gray shaded histogram) are plotted for reference. (D) Quantification of data presented in (A) along with the addition of Ptprc−/−, Csk+/−, L/− Csk+/+, and L/− Csk+/− mice. Values are the mean of at least three independent experiments +/− SEM. P values listed on graph are non-significant and intended to demonstrate absence of rescue by Csk dose reduction.

Similar articles

Cited by

References

    1. Appleby MW, Gross JA, Cooke MP, Levin SD, Qian X, Perlmutter RM. Defective T cell receptor signaling in mice lacking the thymic isoform of p59fyn. Cell. 1992;70:751–763. - PubMed
    1. Ashwell JD, D'Oro U. CD45 and Src-family kinases: and now for something completely different. Immunol Today. 1999;20:412–416. - PubMed
    1. Azzam HS, Grinberg A, Lui K, Shen H, Shores EW, Love PE. CD5 expression is developmentally regulated by T cell receptor (TCR) signals and TCR avidity. J Exp Med. 1998;188:2301–2311. - PMC - PubMed
    1. Barnden MJ, Allison J, Heath WR, Carbone FR. Defective TCR expression in transgenic mice constructed using cDNA-based alpha- and beta-chain genes under the control of heterologous regulatory elements. Immunol Cell Biol. 1998;76:34–40. - PubMed
    1. Becker AM, DeFord-Watts LM, Wuelfing C, van Oers NS. The constitutive tyrosine phosphorylation of CD3zeta results from TCR-MHC interactions that are independent of thymic selection. J Immunol. 2007;178:4120–4128. - PubMed

Publication types

MeSH terms