

Dietary bioflavonoids inhibit Escherichia coli ATP synthase in a differential manner
- PMID: 20346967
- PMCID: PMC2862773
- DOI: 10.1016/j.ijbiomac.2010.03.009
Dietary bioflavonoids inhibit Escherichia coli ATP synthase in a differential manner
Abstract
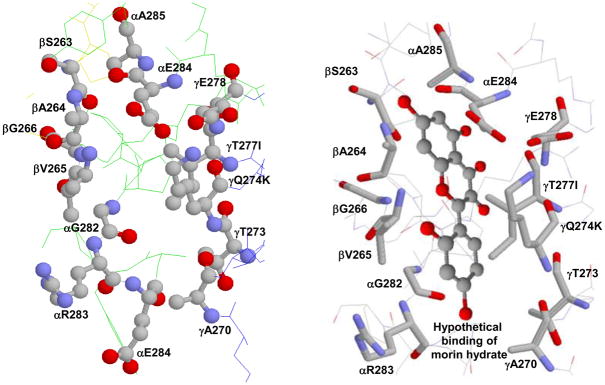
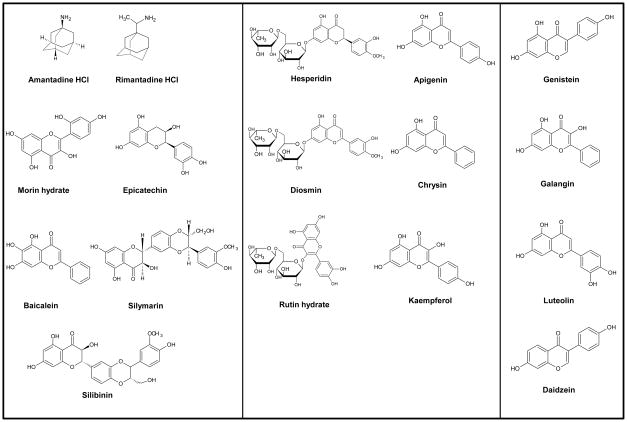
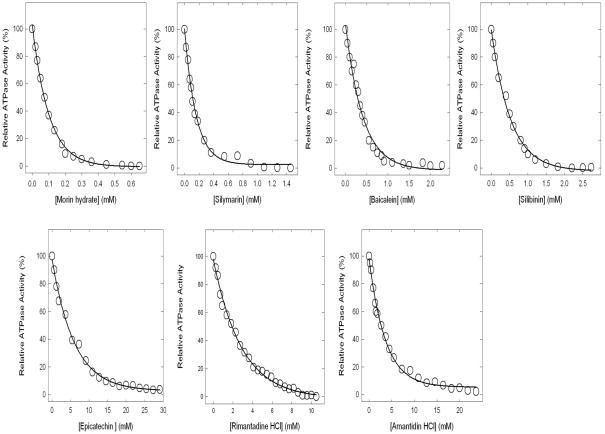
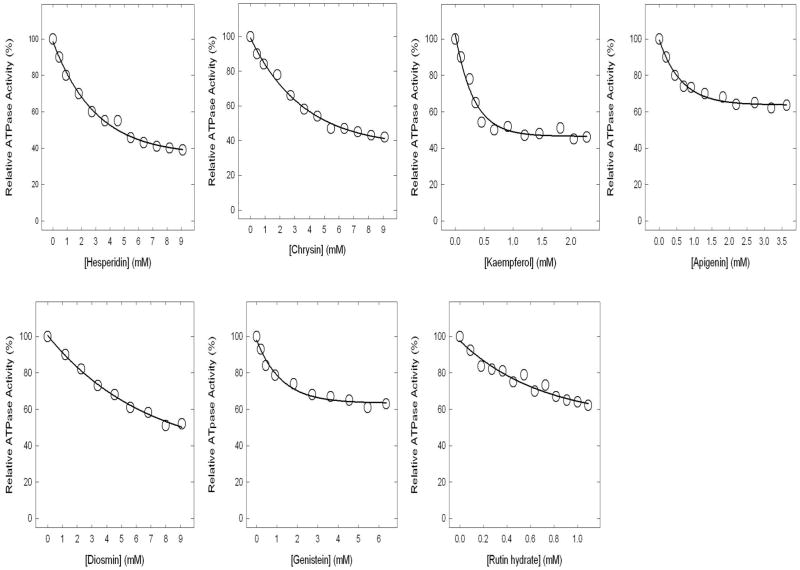
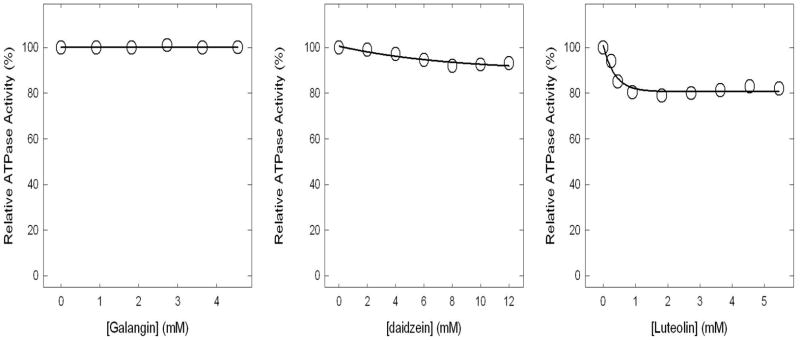
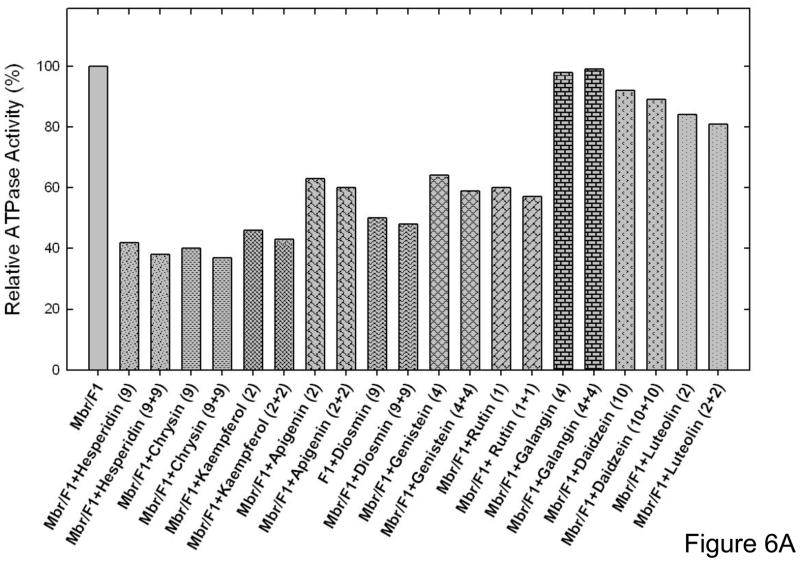
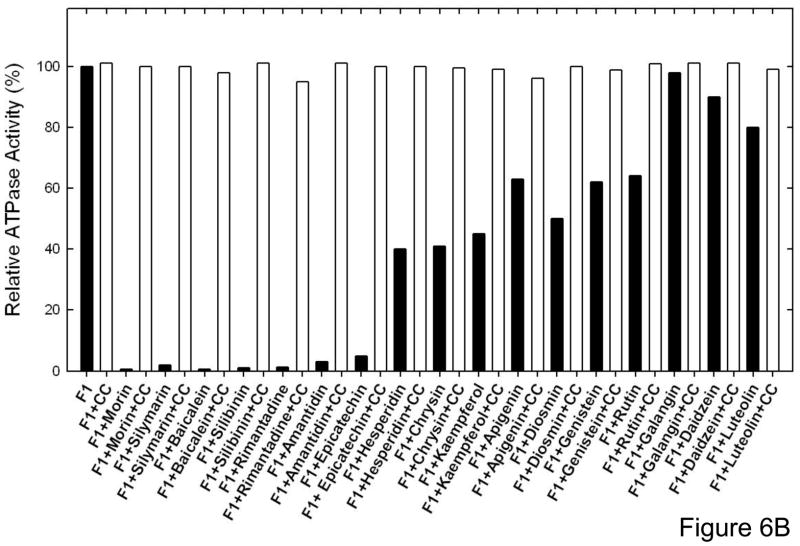
The aim of this study was to determine if the dietary benefits of bioflavonoids are linked to the inhibition of ATP synthase. We studied the inhibitory effect of 17 bioflavonoid compounds on purified F1 or membrane bound F1Fo E. coli ATP synthase. We found that the extent of inhibition by bioflavonoid compounds was variable. Morin, silymarin, baicalein, silibinin, rimantadin, amantidin, or, epicatechin resulted in complete inhibition. The most potent inhibitors on molar scale were morin (IC50 approximately 0.07 mM)>silymarin (IC50 approximately 0.11 mM)>baicalein (IC50 approximately 0.29 mM)>silibinin (IC50 approximately 0.34 mM)>rimantadin (IC50 approximately 2.0 mM)>amantidin (IC50 approximately 2.5 mM)>epicatechin (IC50 approximately 4.0 mM). Inhibition by hesperidin, chrysin, kaempferol, diosmin, apigenin, genistein, or rutin was partial in the range of 40-60% and inhibition by galangin, daidzein, or luteolin was insignificant. The main skeleton, size, shape, geometry, and position of functional groups on inhibitors played important role in the effective inhibition of ATP synthase. In all cases inhibition was found fully reversible and identical in both F1Fo membrane preparations and isolated purified F1. ATPase and growth assays suggested that the bioflavonoid compounds used in this study inhibited F1-ATPase as well as ATP synthesis nearly equally, which signifies a link between the beneficial effects of dietary bioflavonoids and their inhibitory action on ATP synthase.
Copyright 2010 Elsevier B.V. All rights reserved.
Figures
Similar articles
-
Effect of structural modulation of polyphenolic compounds on the inhibition of Escherichia coli ATP synthase.Int J Biol Macromol. 2012 Apr 1;50(3):476-86. doi: 10.1016/j.ijbiomac.2012.01.019. Epub 2012 Jan 20. Int J Biol Macromol. 2012. PMID: 22285988 Free PMC article.
-
Inhibition of Escherichia coli ATP synthase by amphibian antimicrobial peptides.Int J Biol Macromol. 2010 Apr 1;46(3):367-74. doi: 10.1016/j.ijbiomac.2010.01.015. Epub 2010 Jan 25. Int J Biol Macromol. 2010. PMID: 20100509 Free PMC article.
-
Safranal and its analogs inhibit Escherichia coli ATP synthase and cell growth.Int J Biol Macromol. 2017 Feb;95:145-152. doi: 10.1016/j.ijbiomac.2016.11.038. Epub 2016 Nov 16. Int J Biol Macromol. 2017. PMID: 27865956 Free PMC article.
-
ATP synthase from Escherichia coli: Mechanism of rotational catalysis, and inhibition with the ε subunit and phytopolyphenols.Biochim Biophys Acta. 2016 Feb;1857(2):129-140. doi: 10.1016/j.bbabio.2015.11.005. Epub 2015 Nov 14. Biochim Biophys Acta. 2016. PMID: 26589785 Review.
-
Recent developments on structural and functional aspects of the F1 sector of H+-linked ATPases.Mol Cell Biochem. 1984;60(1):33-71. doi: 10.1007/BF00226299. Mol Cell Biochem. 1984. PMID: 6231469 Review.
Cited by
-
Potential of Selected African Medicinal Plants as Alternative Therapeutics against Multi-Drug-Resistant Bacteria.Biomedicines. 2023 Sep 22;11(10):2605. doi: 10.3390/biomedicines11102605. Biomedicines. 2023. PMID: 37892979 Free PMC article. Review.
-
Thymoquinone Inhibits Escherichia coli ATP Synthase and Cell Growth.PLoS One. 2015 May 21;10(5):e0127802. doi: 10.1371/journal.pone.0127802. eCollection 2015. PLoS One. 2015. PMID: 25996607 Free PMC article.
-
Green Tea Catechins: Their Use in Treating and Preventing Infectious Diseases.Biomed Res Int. 2018 Jul 17;2018:9105261. doi: 10.1155/2018/9105261. eCollection 2018. Biomed Res Int. 2018. PMID: 30105263 Free PMC article. Review.
-
Defueling the cancer: ATP synthase as an emerging target in cancer therapy.Mol Ther Oncolytics. 2021 Sep 3;23:82-95. doi: 10.1016/j.omto.2021.08.015. eCollection 2021 Dec 17. Mol Ther Oncolytics. 2021. PMID: 34703878 Free PMC article. Review.
-
Venom peptides cathelicidin and lycotoxin cause strong inhibition of Escherichia coli ATP synthase.Int J Biol Macromol. 2016 Jun;87:246-51. doi: 10.1016/j.ijbiomac.2016.02.061. Epub 2016 Feb 27. Int J Biol Macromol. 2016. PMID: 26930579 Free PMC article.
References
-
- Senior AE, Nadanaciva S, Weber J. Biochim Biophys Acta. 2002;1553:188–211. - PubMed
-
- Abrahams JP, Leslie AGW, Lutter R, Walker JE. Nature. 1994;370:621–628. - PubMed
-
- Diez M, Zimmermann B, Borsch M, Konig M, Schweinberger E, Steigmiller S, Reuter R, Felekyan S, Kudryavtsev V, Seidel CAM, Graber P. Nat Struct Mol Biol. 2004;11:135–141. - PubMed
-
- Itoh H, Takahashi A, Adachi K, Noji H, Yasuda R, Yoshida M, Kinosita K. Nature. 2004;427:465–468. - PubMed
-
- Senior AE. Cell. 2007;130:220–221. - PubMed
Publication types
MeSH terms
Substances
Grants and funding
LinkOut - more resources
Full Text Sources
