Predicting clinical scores from magnetic resonance scans in Alzheimer's disease
- PMID: 20347044
- PMCID: PMC2871976
- DOI: 10.1016/j.neuroimage.2010.03.051
Predicting clinical scores from magnetic resonance scans in Alzheimer's disease
Abstract
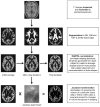
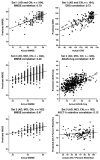
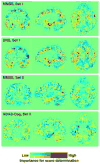
Machine learning and pattern recognition methods have been used to diagnose Alzheimer's disease (AD) and mild cognitive impairment (MCI) from individual MRI scans. Another application of such methods is to predict clinical scores from individual scans. Using relevance vector regression (RVR), we predicted individuals' performances on established tests from their MRI T1 weighted image in two independent data sets. From Mayo Clinic, 73 probable AD patients and 91 cognitively normal (CN) controls completed the Mini-Mental State Examination (MMSE), Dementia Rating Scale (DRS), and Auditory Verbal Learning Test (AVLT) within 3months of their scan. Baseline MRI's from the Alzheimer's disease Neuroimaging Initiative (ADNI) comprised the other data set; 113 AD, 351 MCI, and 122 CN subjects completed the MMSE and Alzheimer's Disease Assessment Scale-Cognitive subtest (ADAS-cog) and 39 AD, 92 MCI, and 32 CN ADNI subjects completed MMSE, ADAS-cog, and AVLT. Predicted and actual clinical scores were highly correlated for the MMSE, DRS, and ADAS-cog tests (P<0.0001). Training with one data set and testing with another demonstrated stability between data sets. DRS, MMSE, and ADAS-Cog correlated better than AVLT with whole brain grey matter changes associated with AD. This result underscores their utility for screening and tracking disease. RVR offers a novel way to measure interactions between structural changes and neuropsychological tests beyond that of univariate methods. In clinical practice, we envision using RVR to aid in diagnosis and predict clinical outcome.
Copyright 2010 Elsevier Inc. All rights reserved.
Conflict of interest statement
The authors have no conflict of interest or financial involvement with this manuscript.
Figures


Similar articles
-
The Neuropsychological Correlates of Brain Perfusion and Gray Matter Volume in Alzheimer's Disease.J Alzheimers Dis. 2020;78(4):1639-1652. doi: 10.3233/JAD-200676. J Alzheimers Dis. 2020. PMID: 33185599
-
Bayesian estimation for the accuracy of three neuropsychological tests in detecting Alzheimer's disease and mild cognitive impairment: a retrospective analysis of the ADNI database.Eur J Med Res. 2023 Oct 12;28(1):427. doi: 10.1186/s40001-023-01265-6. Eur J Med Res. 2023. PMID: 37821912 Free PMC article.
-
Predicting conversion of patients with Mild Cognitive Impairment to Alzheimer's disease using bedside cognitive assessments.J Clin Exp Neuropsychol. 2022 Dec;44(10):703-712. doi: 10.1080/13803395.2023.2167942. Epub 2023 Feb 20. J Clin Exp Neuropsychol. 2022. PMID: 36803664
-
The Alzheimer's Disease Assessment Scale: patterns and predictors of baseline cognitive performance in multicenter Alzheimer's disease trials.Neurology. 1997 Jun;48(6):1511-7. doi: 10.1212/wnl.48.6.1511. Neurology. 1997. PMID: 9191757 Clinical Trial.
-
Longitudinal changes in white matter disease and cognition in the first year of the Alzheimer disease neuroimaging initiative.Arch Neurol. 2010 Nov;67(11):1370-8. doi: 10.1001/archneurol.2010.284. Arch Neurol. 2010. PMID: 21060014 Free PMC article. Clinical Trial.
Cited by
-
Semi-supervised multimodal relevance vector regression improves cognitive performance estimation from imaging and biological biomarkers.Neuroinformatics. 2013 Jul;11(3):339-53. doi: 10.1007/s12021-013-9180-7. Neuroinformatics. 2013. PMID: 23504659 Free PMC article.
-
Fused Group Lasso Regularized Multi-Task Feature Learning and Its Application to the Cognitive Performance Prediction of Alzheimer's Disease.Neuroinformatics. 2019 Apr;17(2):271-294. doi: 10.1007/s12021-018-9398-5. Neuroinformatics. 2019. PMID: 30284672
-
Multiparametric brainstem segmentation using a modified multivariate mixture of Gaussians.Neuroimage Clin. 2013 May 16;2:684-94. doi: 10.1016/j.nicl.2013.04.017. eCollection 2013. Neuroimage Clin. 2013. PMID: 24179820 Free PMC article.
-
Sparse canonical correlation analysis relates network-level atrophy to multivariate cognitive measures in a neurodegenerative population.Neuroimage. 2014 Jan 1;84:698-711. doi: 10.1016/j.neuroimage.2013.09.048. Epub 2013 Oct 2. Neuroimage. 2014. PMID: 24096125 Free PMC article.
-
Grab-AD: Generalizability and reproducibility of altered brain activity and diagnostic classification in Alzheimer's Disease.Hum Brain Mapp. 2020 Aug 15;41(12):3379-3391. doi: 10.1002/hbm.25023. Epub 2020 May 4. Hum Brain Mapp. 2020. PMID: 32364666 Free PMC article.
References
-
- American Psychiatric Association. Diagnostic and statistical manual of mental disorders. Washington, D.C.: American Psychiatric Press; 1987.
-
- Apostolova LG, Lu PH, Rogers S, Dutton RA, Hayashi KM, Toga AW, Cummings JL, Thompson PM. 3D mapping of mini-mental state examination performance in clinical and preclinical Alzheimer disease. Alzheimer Dis Assoc Disord. 2006;20:224–231. - PubMed
-
- Ashburner J. A fast diffeomorphic image registration algorithm. Neuroimage. 2007;38:95–113. - PubMed
-
- Ashburner J, Friston KJ. Voxel-based morphometry--the methods. Neuroimage. 2000;11:805–821. - PubMed
-
- Ashburner J, Friston KJ. Unified segmentation. Neuroimage. 2005;26:839–851. - PubMed
Publication types
MeSH terms
Grants and funding
LinkOut - more resources
Full Text Sources
Other Literature Sources
Medical

