

Mitochondrial dysfunction precedes insulin resistance and hepatic steatosis and contributes to the natural history of non-alcoholic fatty liver disease in an obese rodent model
- PMID: 20347174
- PMCID: PMC3070177
- DOI: 10.1016/j.jhep.2009.11.030
Mitochondrial dysfunction precedes insulin resistance and hepatic steatosis and contributes to the natural history of non-alcoholic fatty liver disease in an obese rodent model
Abstract
Background & aims: In this study, we sought to determine the temporal relationship between hepatic mitochondrial dysfunction, hepatic steatosis and insulin resistance, and to examine their potential role in the natural progression of non-alcoholic fatty liver disease (NAFLD) utilising a sedentary, hyperphagic, obese, Otsuka Long-Evans Tokushima Fatty (OLETF) rat model.
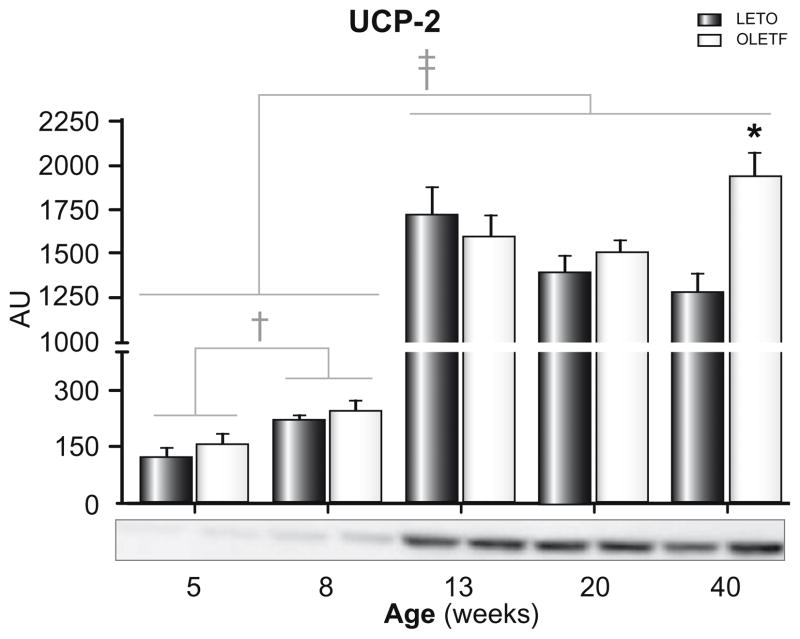
Methods: OLETF rats and their non-hyperphagic control Long-Evans Tokushima Otsuka (LETO) rats were sacrificed at 5, 8, 13, 20, and 40 weeks of age (n=6-8 per group).
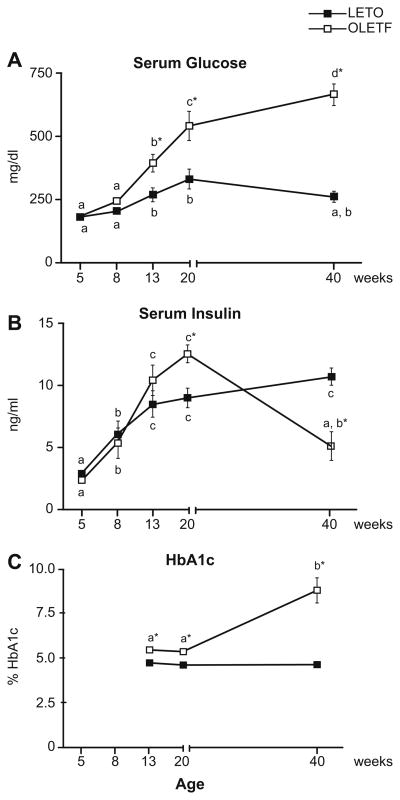
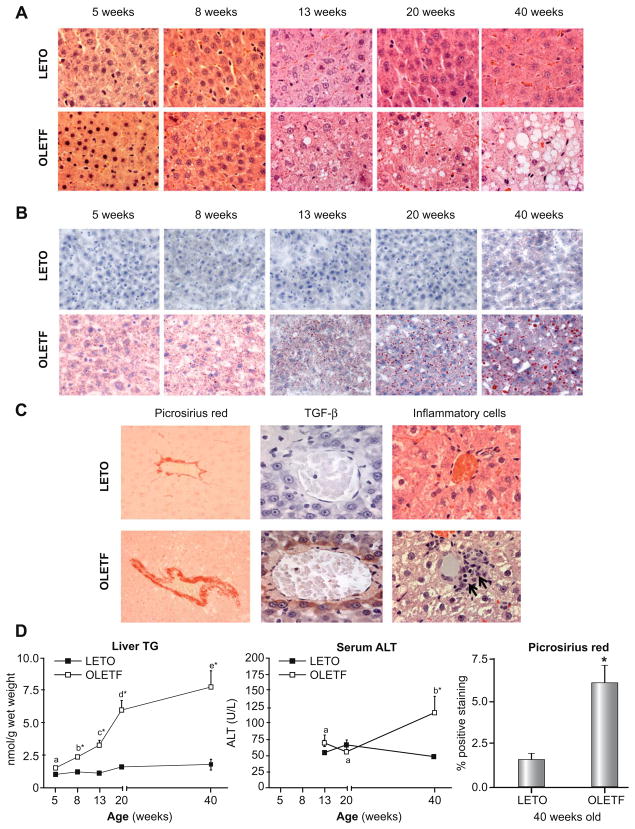
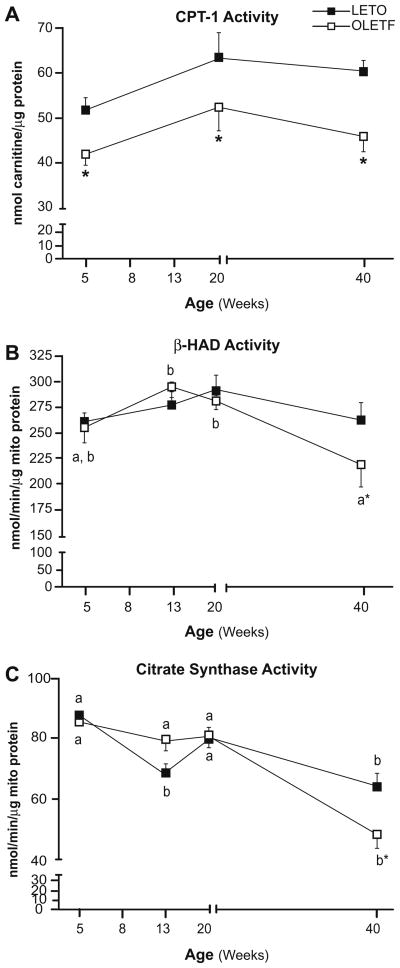
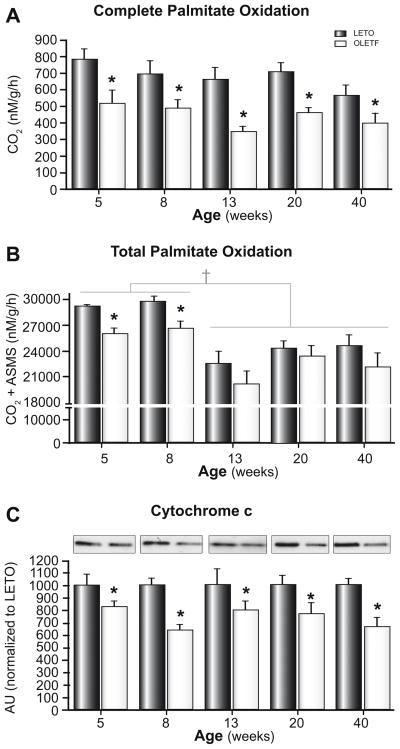
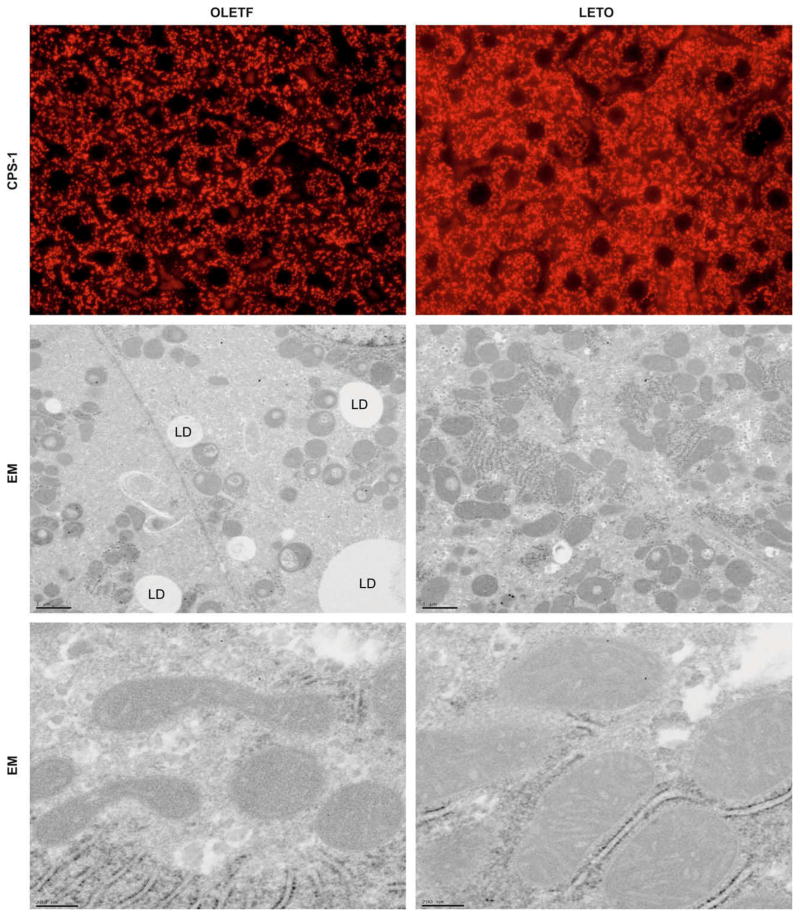
Results: At 5 weeks of age, serum insulin and glucose and hepatic triglyceride (TG) concentrations did not differ between animal groups; however, OLETF animals displayed significant (p<0.01) hepatic mitochondrial dysfunction as measured by reduced hepatic carnitine palmitoyl-CoA transferase-1 activity, fatty acid oxidation, and cytochrome c protein content compared with LETO rats. Hepatic TG levels were significantly elevated by 8 weeks of age, and insulin resistance developed by 13 weeks in the OLETF rats. NAFLD progressively worsened to include hepatocyte ballooning, perivenular fibrosis, 2.5-fold increase in serum ALT, hepatic mitochondrial ultrastructural abnormalities, and increased hepatic oxidative stress in the OLETF animals at later ages. Measures of hepatic mitochondrial content and function including beta-hydroxyacyl-CoA dehydrogenase activity, citrate synthase activity, and immunofluorescence staining for mitochondrial carbamoyl phosphate synthetase-1, progressively worsened and were significantly reduced at 40 weeks in OLETF rats compared to LETO animals.
Conclusions: Our study documents that hepatic mitochondrial dysfunction precedes the development of NAFLD and insulin resistance in the OLETF rats. This evidence suggests that progressive mitochondrial dysfunction contributes to the natural history of obesity-associated NAFLD.
Copyright (c) 2010 European Association for the Study of the Liver. Published by Elsevier B.V. All rights reserved.
Conflict of interest statement
The authors who have taken part in this study declared that they do not have anything to declare regarding funding from industry or conflict of interest with respect to this manuscript.
Figures
Similar articles
-
Daily exercise vs. caloric restriction for prevention of nonalcoholic fatty liver disease in the OLETF rat model.Am J Physiol Gastrointest Liver Physiol. 2011 May;300(5):G874-83. doi: 10.1152/ajpgi.00510.2010. Epub 2011 Feb 24. Am J Physiol Gastrointest Liver Physiol. 2011. PMID: 21350190 Free PMC article.
-
Changes in skeletal muscle mitochondria in response to the development of type 2 diabetes or prevention by daily wheel running in hyperphagic OLETF rats.Am J Physiol Endocrinol Metab. 2010 Jun;298(6):E1179-87. doi: 10.1152/ajpendo.00703.2009. Epub 2010 Mar 16. Am J Physiol Endocrinol Metab. 2010. PMID: 20233940 Free PMC article.
-
A return to ad libitum feeding following caloric restriction promotes hepatic steatosis in hyperphagic OLETF rats.Am J Physiol Gastrointest Liver Physiol. 2016 Sep 1;311(3):G387-95. doi: 10.1152/ajpgi.00089.2016. Epub 2016 Jul 21. Am J Physiol Gastrointest Liver Physiol. 2016. PMID: 27445343 Free PMC article.
-
Nonalcoholic Fatty Liver Disease and Staging of Hepatic Fibrosis.Adv Exp Med Biol. 2024;1460:539-574. doi: 10.1007/978-3-031-63657-8_18. Adv Exp Med Biol. 2024. PMID: 39287864 Review.
-
Interrelationships between hepatic fat and insulin resistance in non-alcoholic fatty liver disease.Curr Diabetes Rev. 2010 Sep;6(5):341-7. doi: 10.2174/157339910793360879. Curr Diabetes Rev. 2010. PMID: 20701585 Review.
Cited by
-
The effects of chronic AMPK activation on hepatic triglyceride accumulation and glycerol 3-phosphate acyltransferase activity with high fat feeding.Diabetol Metab Syndr. 2013 May 31;5:29. doi: 10.1186/1758-5996-5-29. eCollection 2013. Diabetol Metab Syndr. 2013. PMID: 23725555 Free PMC article.
-
Exploring the Multifaceted Landscape of MASLD: A Comprehensive Synthesis of Recent Studies, from Pathophysiology to Organoids and Beyond.Biomedicines. 2024 Feb 8;12(2):397. doi: 10.3390/biomedicines12020397. Biomedicines. 2024. PMID: 38397999 Free PMC article. Review.
-
PGC-1α overexpression results in increased hepatic fatty acid oxidation with reduced triacylglycerol accumulation and secretion.Am J Physiol Gastrointest Liver Physiol. 2012 Oct 15;303(8):G979-92. doi: 10.1152/ajpgi.00169.2012. Epub 2012 Aug 16. Am J Physiol Gastrointest Liver Physiol. 2012. PMID: 22899824 Free PMC article.
-
Mitochondrial morphology in metabolic diseases.Antioxid Redox Signal. 2013 Aug 1;19(4):415-30. doi: 10.1089/ars.2012.4779. Epub 2012 Aug 27. Antioxid Redox Signal. 2013. PMID: 22793999 Free PMC article. Review.
-
Transcriptomic analysis of hepatic responses to testosterone deficiency in miniature pigs fed a high-cholesterol diet.BMC Genomics. 2015 Feb 6;16(1):59. doi: 10.1186/s12864-015-1283-0. BMC Genomics. 2015. PMID: 25887406 Free PMC article.
References
-
- Browning JD, Szczepaniak LS, Dobbins R, Nuremberg P, Horton JD, Cohen JC, et al. Prevalence of hepatic steatosis in an urban population in the United States: impact of ethnicity. Hepatology. 2004;40:1387–1395. - PubMed
-
- Bellentani S, Saccoccio G, Masutti F, Croce LS, Brandi G, Sasso F, et al. Prevalence of and risk factors for hepatic steatosis in Northern Italy. Ann Intern Med. 2000;132:112–117. - PubMed
-
- Farrell GC, Larter CZ. Non-alcoholic fatty liver disease: from steatosis to cirrhosis. Hepatology. 2006;43:S99–S112. - PubMed
-
- Chiarelli F, Marcovecchio ML. Insulin resistance and obesity in childhood. Eur J Endocrinol. 2008;159:S67–S74. - PubMed
-
- Schwimmer JB, Deutsch R, Kahen T, Lavine JE, Stanley C, Behling C. Prevalence of fatty liver in children and adolescents. Pediatrics. 2006;118:1388–1393. - PubMed
Publication types
MeSH terms
Substances
Grants and funding
LinkOut - more resources
Full Text Sources
Other Literature Sources
Medical
Miscellaneous
