

Insulin-like growth factors I and II receptors in the breast cancer survival disparity among African-American women
- PMID: 20347606
- PMCID: PMC2875325
- DOI: 10.1016/j.ghir.2010.03.001
Insulin-like growth factors I and II receptors in the breast cancer survival disparity among African-American women
Erratum in
-
Corrigendum to "Insulin-like growth Factors I and II receptors in the breast cancer disparity" among African-American women [Growth Hormone & IGF Research 20 (2010) 245-254].Growth Horm IGF Res. 2022 Dec;67:101512. doi: 10.1016/j.ghir.2022.101512. Epub 2022 Oct 21. Growth Horm IGF Res. 2022. PMID: 36280533 No abstract available.
Abstract
Objective: African-American (AA) women with breast cancer are more likely to have advanced disease at diagnosis, higher risk of recurrence and poorer prognosis than Caucasian (CA) women. We have recently shown higher insulin-like growth factor II (IGF-II) expression in paired breast tissue samples from AA women as compared to CA women. IGF-II is a potent mitogen that induces cell proliferation and survival signals through activation of the IGF-I and Insulin receptors (IGF-IR, IR) while IGF-II circulating levels are regulated by cellular uptake through the IGF2 receptor. We hypothesize that differential expression of the IGF1R and IGF2R among AA and CA women potentiates IGF-II mitogenic effects, thus contributing to the health disparity observed between these ethnic groups.
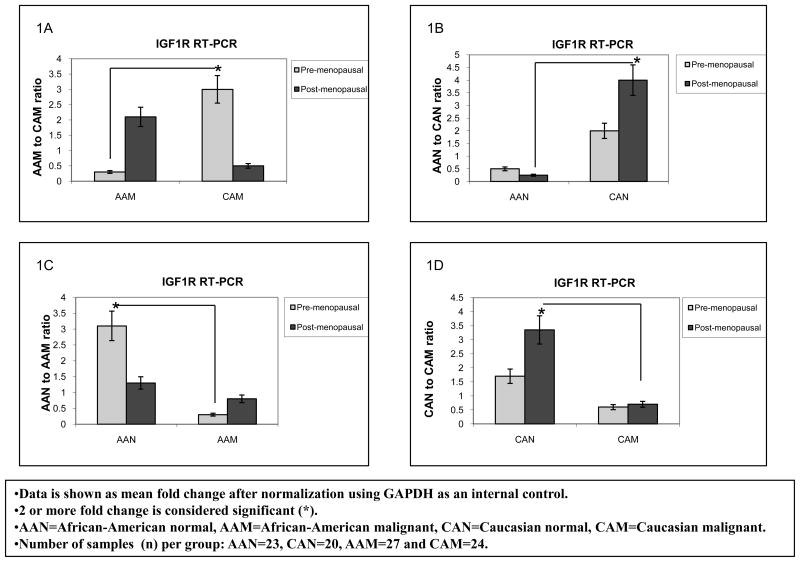
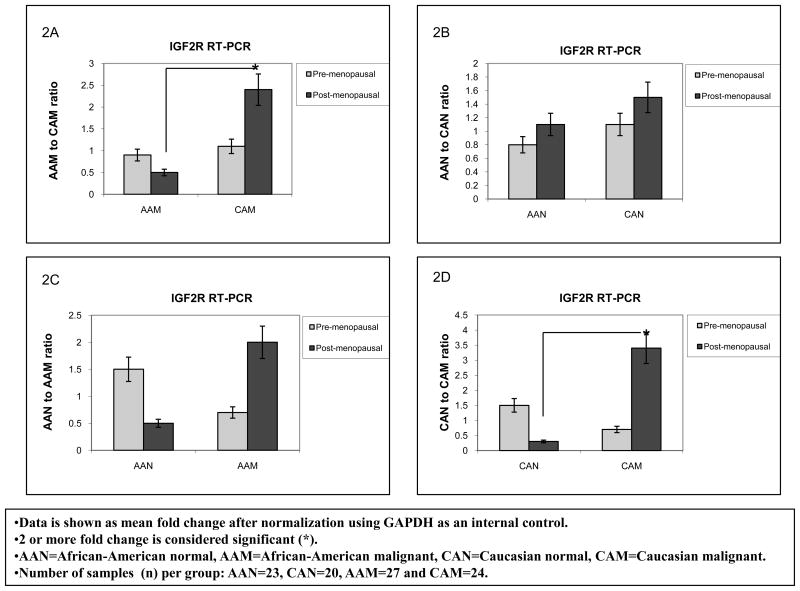
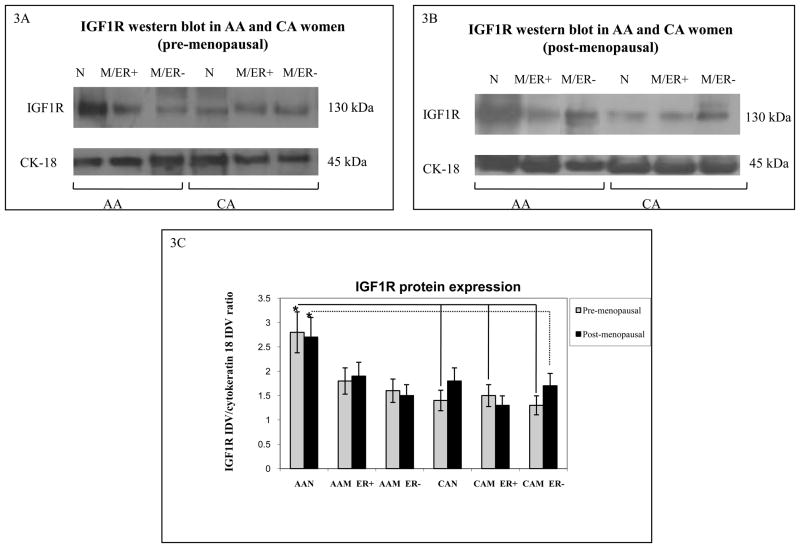
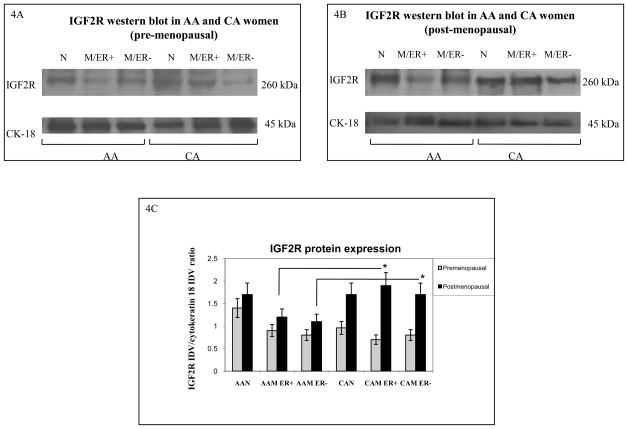
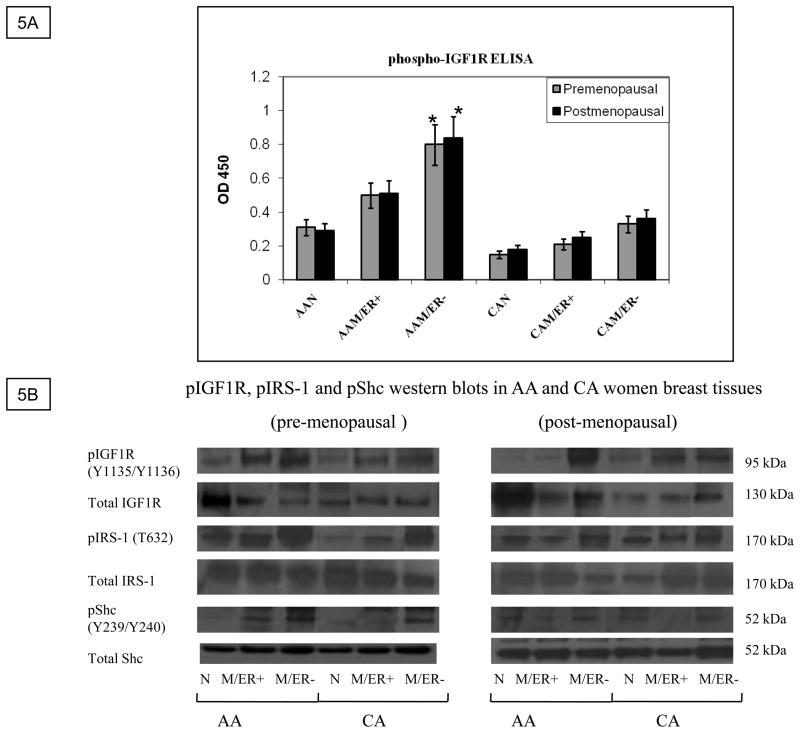
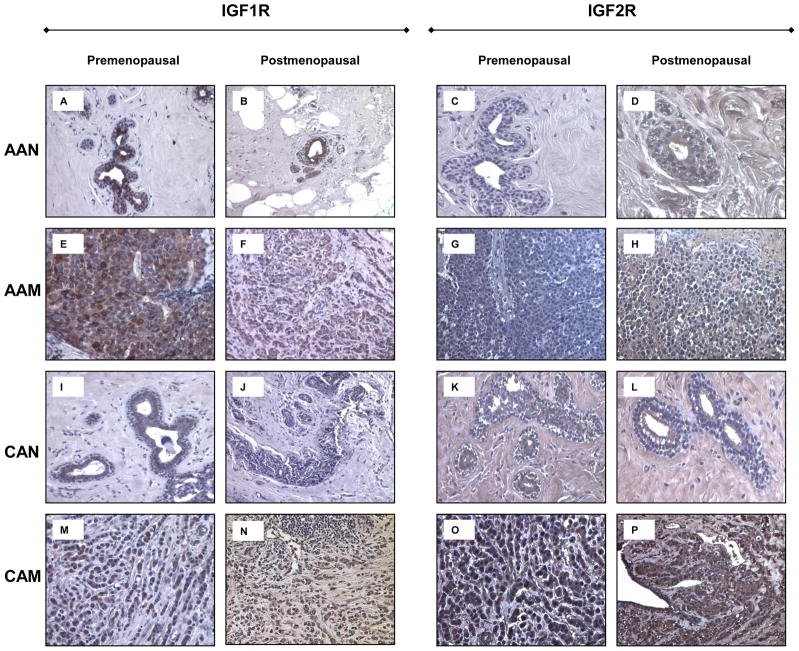
Design: We examined IGF-IR and IGF2R mRNA, protein expression and IGF1R phosphorylation in paired breast tissue samples from AA and CA women by Real Time-PCR, Western blot analysis, immunohistochemistry and ELISA techniques.
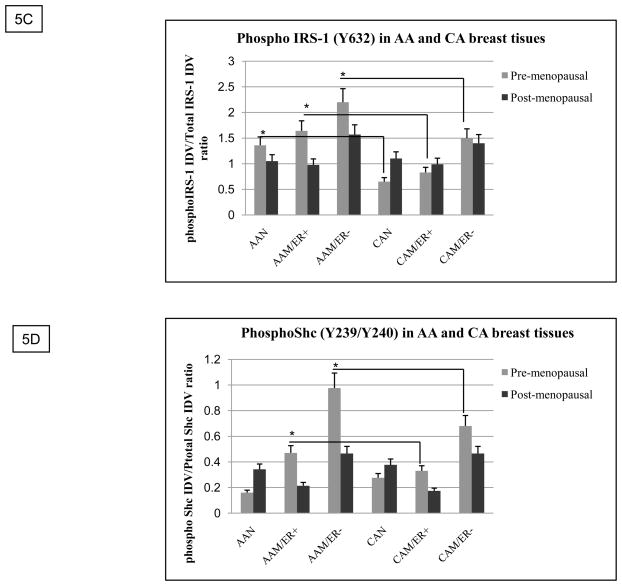
Results: Our results showed significantly increased expression of IGF1R in AA normal tissues as compared to CA normal tissues. IGF1R expression was similar between AA normal and malignant tissues, while IGF1R, IRS-1 and Shc phosphorylation was significantly higher in AA tumor samples. Significantly higher levels of IGF2R were found in CA tumor samples as compared to AA tumor samples.
Conclusions: We conclude that IGF1R and IGF2R differential expression may contribute to the increased risk of malignant transformation in young AA women and to the more aggressive breast cancer phenotype observed among AA breast cancer patients and represent, along with IGF-II, potential therapeutic targets in breast cancer.
Copyright 2010 Elsevier Ltd. All rights reserved.
Figures
Similar articles
-
Differential insulin-like growth factor II (IGF-II) expression: A potential role for breast cancer survival disparity.Growth Horm IGF Res. 2010 Apr;20(2):162-70. doi: 10.1016/j.ghir.2009.12.002. Epub 2010 Jan 25. Growth Horm IGF Res. 2010. PMID: 20089431 Free PMC article.
-
Down-regulation of insulin-like growth factor-I receptor and insulin receptor substrate-1 expression in advanced human breast cancer.Int J Cancer. 2000 Nov 20;89(6):506-13. doi: 10.1002/1097-0215(20001120)89:6<506::aid-ijc7>3.0.co;2-f. Int J Cancer. 2000. PMID: 11102895
-
Differential expression of breast cancer-associated genes between stage- and age-matched tumor specimens from African- and Caucasian-American Women diagnosed with breast cancer.BMC Res Notes. 2012 May 22;5:248. doi: 10.1186/1756-0500-5-248. BMC Res Notes. 2012. PMID: 22616718 Free PMC article.
-
Insulin-like growth factors in human breast cancer.Breast Cancer Res Treat. 1998;52(1-3):175-84. doi: 10.1023/a:1006127621512. Breast Cancer Res Treat. 1998. PMID: 10066081 Review.
-
Mammography screening and breast cancer biology in African American women--a review.Cancer Detect Prev. 2002;26(3):180-91. doi: 10.1016/s0361-090x(02)00062-4. Cancer Detect Prev. 2002. PMID: 12269764 Review.
Cited by
-
Insulin-like growth factor 1 receptor expression in breast cancer tissue and mammographic density.Mol Clin Oncol. 2015 May;3(3):572-580. doi: 10.3892/mco.2015.497. Epub 2015 Jan 27. Mol Clin Oncol. 2015. PMID: 26137269 Free PMC article.
-
Estrogen receptor-beta is a potential target for triple negative breast cancer treatment.Oncotarget. 2018 Sep 21;9(74):33912-33930. doi: 10.18632/oncotarget.26089. eCollection 2018 Sep 21. Oncotarget. 2018. PMID: 30338035 Free PMC article.
-
Differential expression and signaling activation of insulin receptor isoforms A and B: A link between breast cancer and diabetes.Growth Factors. 2011 Dec;29(6):278-89. doi: 10.3109/08977194.2011.616200. Epub 2011 Sep 13. Growth Factors. 2011. PMID: 21913804 Free PMC article.
-
Association of type 2 diabetes genetic variants with breast cancer survival among Chinese women.PLoS One. 2015 Feb 13;10(2):e0117419. doi: 10.1371/journal.pone.0117419. eCollection 2015. PLoS One. 2015. PMID: 25679392 Free PMC article.
-
Spatiotemporal strategies to identify aggressive biology in precancerous breast biopsies.WIREs Mech Dis. 2021 Mar;13(2):e1506. doi: 10.1002/wsbm.1506. Epub 2020 Oct 1. WIREs Mech Dis. 2021. PMID: 33001587 Free PMC article. Review.
References
-
- National Cancer Institute, DC-CPS, Surveillance Research Program, Cancer Statistics Branch; Surveillance, Epidemiology, and End Results program (SEER) SEER Stat Database: Mortality-All COD, Public-Use with State, Total U.S. for Expanded Races/Hispanics (1991–2001) Released April 2004. http://www.seer.cancer.gov.
-
- De Myets P. The structural basis of insulin and insulin-like growth factor-1 receptor binding and negative cooperativity, and its relevance to mitogenic versus metabolic signaling. Diabetologia. 1994;37(Suppl 2):S135–S148. - PubMed
-
- Sciacca L, Constantino A, Pandini G, Mineo R, Frasca F, Scalia P, Sbraccia P, Goldfine ID, Vigneri R, Belfiore A. Insulin receptor activation by IGF-II in breast cancers: evidence for a new autocrine/paracrine mechanism. Oncogene. 1999;18:2471–2479. - PubMed
-
- Voskuil D, Bosma A, Vrieling A, Rookus M, Veer L. IGF system mRNA quantities in normal and tumor breast tissue of women with sporadic and familial breast cancer risk. Breast Cancer Research and Treatment. 2004;84:225–233. - PubMed
Publication types
MeSH terms
Substances
Grants and funding
LinkOut - more resources
Full Text Sources
Medical
Miscellaneous
