Regulation of mitochondrial fission by intracellular Ca2+ in rat ventricular myocytes
- PMID: 20347716
- PMCID: PMC2891135
- DOI: 10.1016/j.bbabio.2010.03.018
Regulation of mitochondrial fission by intracellular Ca2+ in rat ventricular myocytes
Abstract
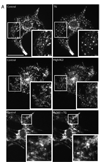
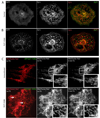
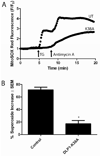
Mitochondria are dynamic organelles that constantly undergo fission, fusion, and movement. Increasing evidence indicates that these dynamic changes are intricately related to mitochondrial function, suggesting that mitochondrial form and function are linked. Calcium (Ca2+) is one signal that has been shown to both regulate mitochondrial fission in various cell types and stimulate mitochondrial enzymes involved in ATP generation. However, although Ca2+ plays an important role in adult cardiac muscle cells for excitation-metabolism coupling, little is known about whether Ca2+ can regulate their mitochondrial morphology. Therefore, we tested the role of Ca2+ in regulating cardiac mitochondrial fission. We found that neonatal and adult cardiomyocyte mitochondria undergo rapid and transient fragmentation upon a thapsigargin (TG)- or KCl-induced cytosolic Ca2+ increase. The mitochondrial fission protein, DLP1, participates in this mitochondrial fragmentation, suggesting that cardiac mitochondrial fission machinery may be regulated by intracellular Ca2+ signaling. Moreover, the TG-induced fragmentation was also associated with an increase in reactive oxygen species (ROS) formation, suggesting that activation of mitochondrial fission machinery is an early event for Ca2+-mediated ROS generation in cardiac myocytes. These results suggest that Ca2+, an important regulator of muscle contraction and energy generation, also dynamically regulates mitochondrial morphology and ROS generation in cardiac myocytes.
Copyright © 2010 Elsevier B.V. All rights reserved.
Figures


Similar articles
-
Mitochondrial fission is required for cardiomyocyte hypertrophy mediated by a Ca2+-calcineurin signaling pathway.J Cell Sci. 2014 Jun 15;127(Pt 12):2659-71. doi: 10.1242/jcs.139394. Epub 2014 Apr 28. J Cell Sci. 2014. PMID: 24777478 Free PMC article.
-
Cardiomyocyte deletion of mitofusin-1 leads to mitochondrial fragmentation and improves tolerance to ROS-induced mitochondrial dysfunction and cell death.Am J Physiol Heart Circ Physiol. 2012 Jan 1;302(1):H167-79. doi: 10.1152/ajpheart.00833.2011. Epub 2011 Oct 28. Am J Physiol Heart Circ Physiol. 2012. PMID: 22037195 Free PMC article.
-
FOXO3a regulates BNIP3 and modulates mitochondrial calcium, dynamics, and function in cardiac stress.Am J Physiol Heart Circ Physiol. 2016 Dec 1;311(6):H1540-H1559. doi: 10.1152/ajpheart.00549.2016. Epub 2016 Sep 30. Am J Physiol Heart Circ Physiol. 2016. PMID: 27694219 Free PMC article.
-
[Advances in mitochondrial fusion-fission and Ca2+ signaling in mammals].Sheng Li Ke Xue Jin Zhan. 2010 Jun;41(3):171-6. Sheng Li Ke Xue Jin Zhan. 2010. PMID: 21416975 Review. Chinese.
-
Mitochondrial dynamics and cell death in heart failure.Heart Fail Rev. 2016 Mar;21(2):123-36. doi: 10.1007/s10741-016-9530-2. Heart Fail Rev. 2016. PMID: 26872674 Review.
Cited by
-
Mitochondrial network in the heart.Protein Cell. 2012 Jun;3(6):410-8. doi: 10.1007/s13238-012-2921-9. Epub 2012 Jul 1. Protein Cell. 2012. PMID: 22752872 Free PMC article. Review.
-
Dyad content is reduced in cardiac myocytes of mice with impaired calmodulin regulation of RyR2.J Muscle Res Cell Motil. 2015 Apr;36(2):205-14. doi: 10.1007/s10974-015-9405-5. Epub 2015 Feb 19. J Muscle Res Cell Motil. 2015. PMID: 25694159
-
Roles of mitochondrial dynamics modulators in cardiac ischaemia/reperfusion injury.J Cell Mol Med. 2017 Nov;21(11):2643-2653. doi: 10.1111/jcmm.13330. Epub 2017 Sep 22. J Cell Mol Med. 2017. PMID: 28941171 Free PMC article. Review.
-
Mitochondria and metabolic transitions in cardiomyocytes: lessons from development for stem cell-derived cardiomyocytes.Stem Cell Res Ther. 2021 Mar 12;12(1):177. doi: 10.1186/s13287-021-02252-6. Stem Cell Res Ther. 2021. PMID: 33712058 Free PMC article. Review.
-
OPA1 mutation and late-onset cardiomyopathy: mitochondrial dysfunction and mtDNA instability.J Am Heart Assoc. 2012 Oct;1(5):e003012. doi: 10.1161/JAHA.112.003012. Epub 2012 Oct 25. J Am Heart Assoc. 2012. PMID: 23316298 Free PMC article.
References
-
- Sharma VK, Ramesh V, Franzini-Armstrong C, Sheu SS. Transport of Ca2+ from sarcoplasmic reticulum to mitochondria in rat ventricular myocytes. J Bioenerg Biomembr. 2000;32:97–104. - PubMed
-
- Santel A, Frank S, Gaume B, Herrler M, Youle RJ, Fuller MT. Mitofusin-1 protein is a generally expressed mediator of mitochondrial fusion in mammalian cells. J Cell Sci. 2003;116:2763–2774. - PubMed
-
- Rojo M, Legros F, Chateau D, Lombes A. Membrane topology and mitochondrial targeting of mitofusins, ubiquitous mammalian homologs of the transmembrane GTPase Fzo. J Cell Sci. 2002;115:1663–1674. - PubMed
-
- Bach D, Pich S, Soriano FX, Vega N, Baumgartner B, Oriola J, Daugaard JR, Lloberas J, Camps M, Zierath JR, Rabasa-Lhoret R, Wallberg-Henriksson H, Laville M, Palacin M, Vidal H, Rivera F, Brand M, Zorzano A. Mitofusin-2 determines mitochondrial network architecture and mitochondrial metabolism. A novel regulatory mechanism altered in obesity. J Biol Chem. 2003;278:17190–17197. - PubMed
Publication types
MeSH terms
Substances
Grants and funding
LinkOut - more resources
Full Text Sources
Miscellaneous

