Review
. 2010 Jul;1798(7):1399-408.
doi: 10.1016/j.bbamem.2010.03.019. Epub 2010 Mar 27.

Lipid packing determines protein-membrane interactions: challenges for apolipoprotein A-I and high density lipoproteins

Affiliations
Review

Lipid packing determines protein-membrane interactions: challenges for apolipoprotein A-I and high density lipoproteins

Susana A Sánchez et al. Biochim Biophys Acta. 2010 Jul.

Abstract

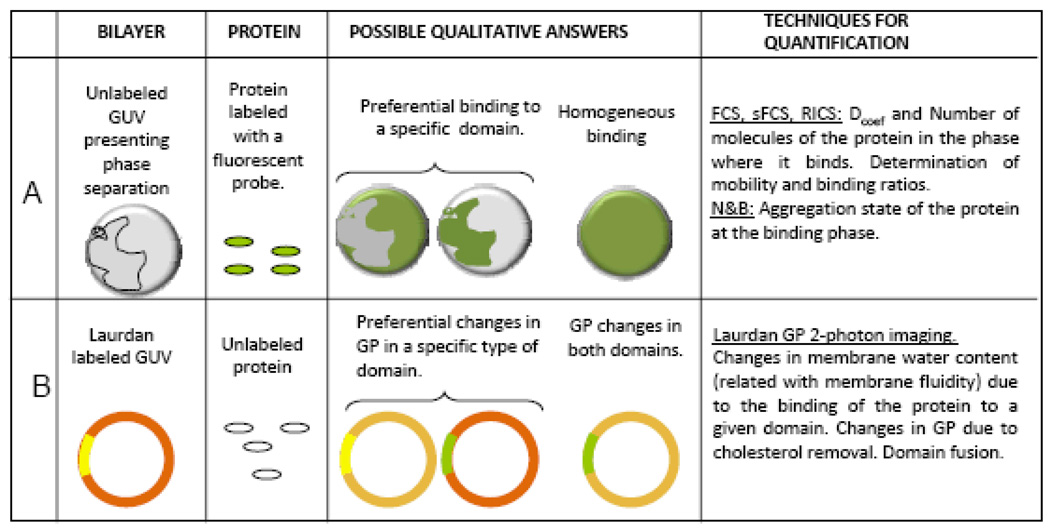
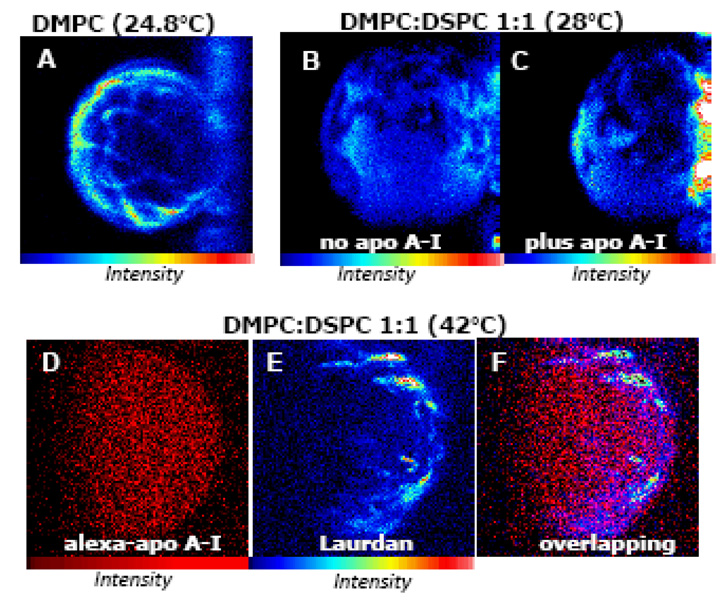
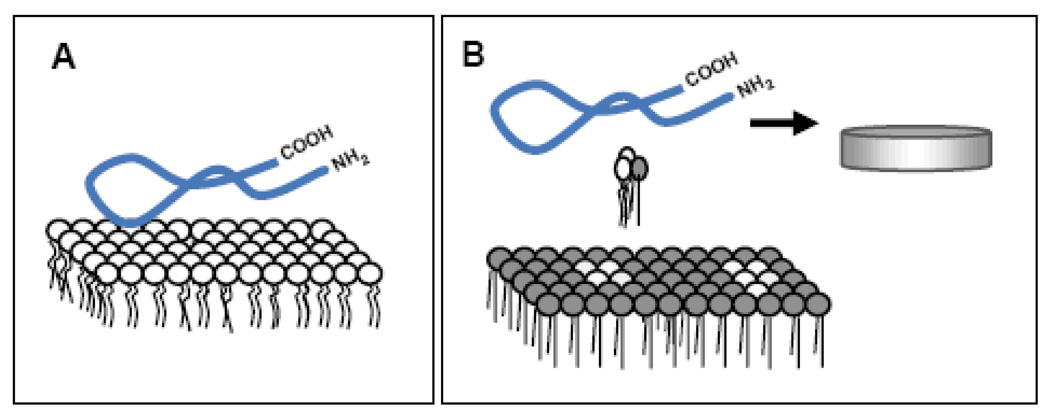
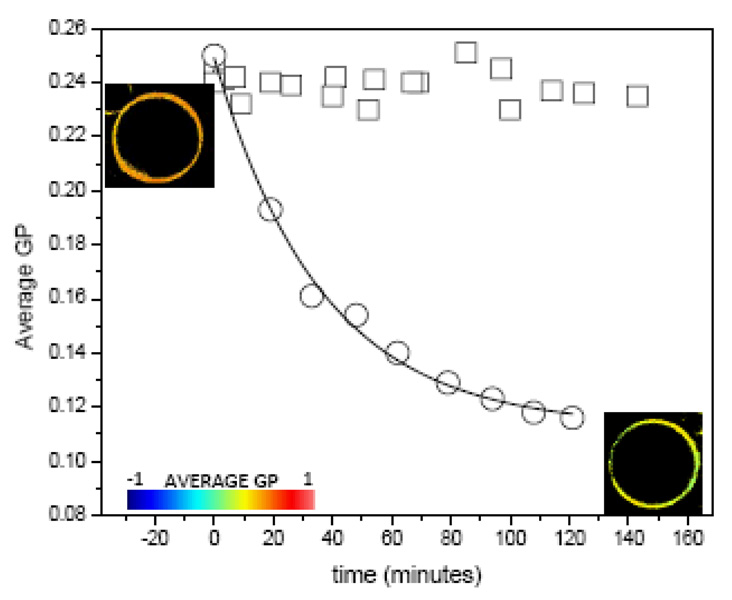
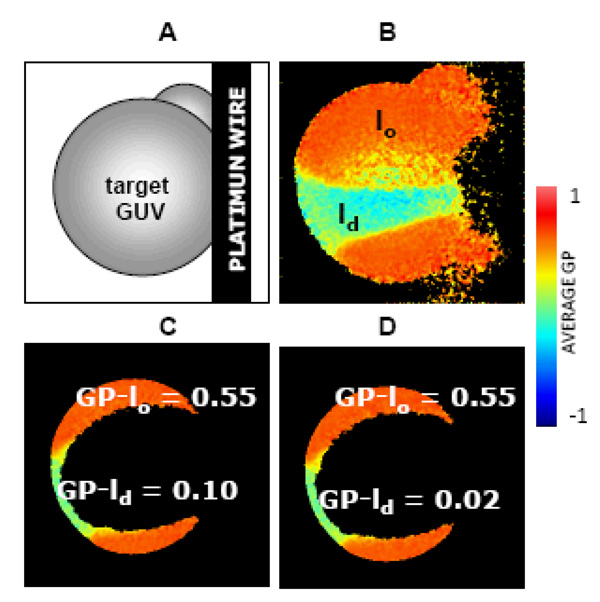
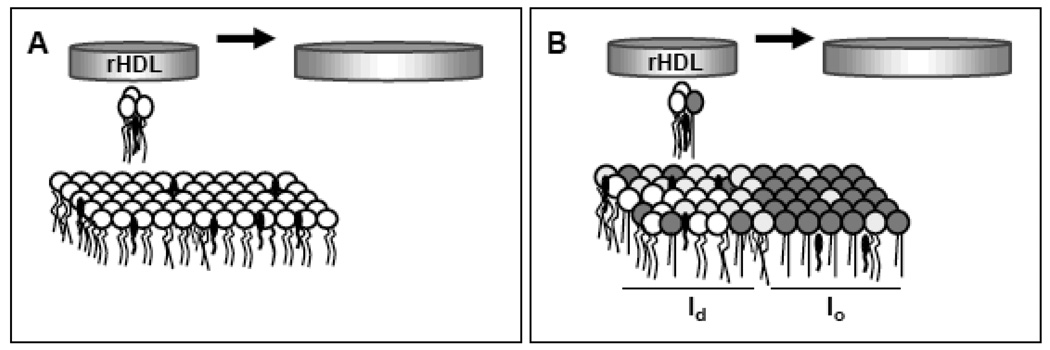
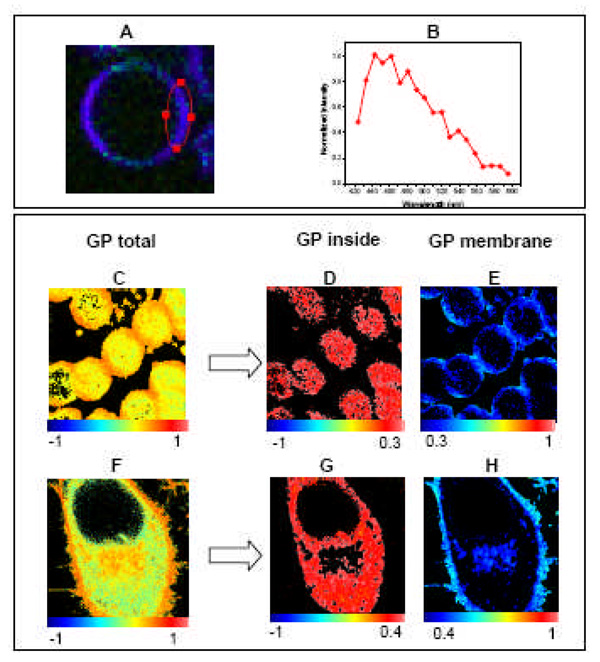
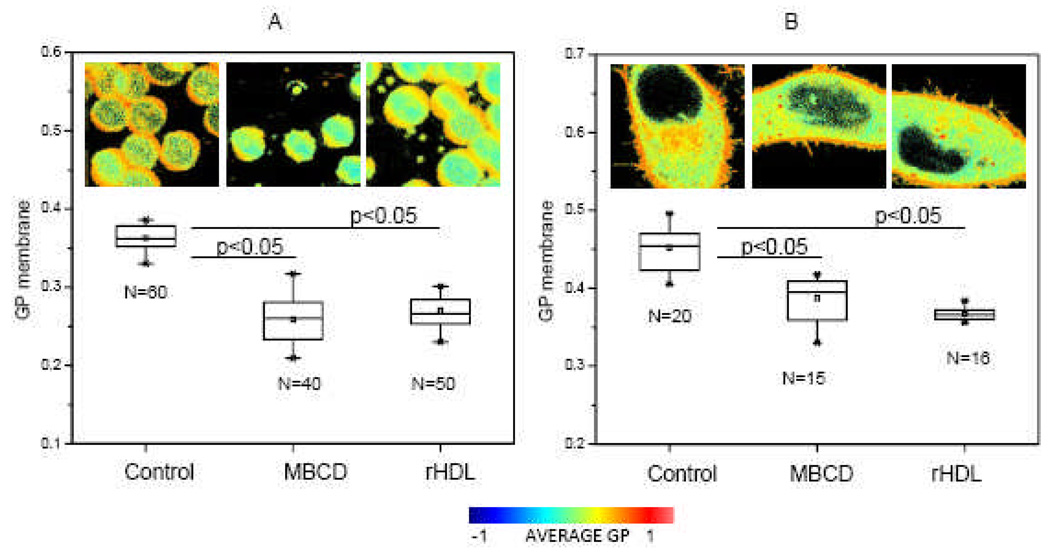
Protein and protein-lipid interactions, with and within specific areas in the cell membrane, are critical in order to modulate the cell signaling events required to maintain cell functions and viability. Biological bilayers are complex, dynamic platforms, and thus in vivo observations usually need to be preceded by studies on model systems that simplify and discriminate the different factors involved in lipid-protein interactions. Fluorescence microscopy studies using giant unilamellar vesicles (GUVs) as membrane model systems provide a unique methodology to quantify protein binding, interaction, and lipid solubilization in artificial bilayers. The large size of lipid domains obtainable on GUVs, together with fluorescence microscopy techniques, provides the possibility to localize and quantify molecular interactions. Fluorescence Correlation Spectroscopy (FCS) can be performed using the GUV model to extract information on mobility and concentration. Two-photon Laurdan Generalized Polarization (GP) reports on local changes in membrane water content (related to membrane fluidity) due to protein binding or lipid removal from a given lipid domain. In this review, we summarize the experimental microscopy methods used to study the interaction of human apolipoprotein A-I (apoA-I) in lipid-free and lipid-bound conformations with bilayers and natural membranes. Results described here help us to understand cholesterol homeostasis and offer a methodological design suited to different biological systems.


Figures

Figure 1
Figure 1
Schematic representation for the experimental protocols used in the studies of lipid-protein interactions in Giant Unilamellar Vesicle system presenting phase co-existence. [A] Binding experiments are performed adding labeled protein to the chamber containing the GUVs. After the incubation period the protein may preferentially bind to one or both types of domains. Different fluctuation techniques (described in the text) can be used to quantify the binding. Circular objects represent the top view of the GUV presenting lipid domains. [B] Laurdan GP imaging is used to detect changes in water content (related to membrane fluidity) in the lipid bilayer due to the interaction with proteins. After the interaction, the GP changes may occur in the two phases or in one of them, both the GP value and the size of the domain can be quantified and give information of the interaction. The ring shapes represent the GP image of a GUV taken at the equatorial plane and presenting domain separation (two different colors represent two macro-domains with different GP value), this configuration is preferred for GP quantification because all the Laurdan molecules (located parallel to the lipids) are excited by the circular polarized light usually used for excitation.
Figure 2
Figure 2. ApoA-I interaction with heterogeneous membranes
[A] Membrane heterogeneities existing at the transition temperature [63]: Laurdan intensity image (top view) of a DMPC GUV at 24.5°C attached to the platinum wire (structure on the right). [B and C] Lipid solubilization from DMPC:DSPC 1:1 GUV by apoA-I occurs at 28°C [68] as evidenced by the decrease in volume of the GUV as comparing the Laurdan intensity image before (B) and after (C) incubation with apoA-I for 2 h. [D, E and F] ApoA-I binding to heterogeneous bilayers: a GUV made of DMPC:DSPC (0.35:0.65 molar ratio) at 42°C. A target GUV was chosen using the CCD camera and the control image taken before the addition of the labeled protein showed background signal ~150 total counts (image not shown). After 2 hours incubation with Alexa 488-apoA-I the intensity image (D) showed ~ 130,000 total counts defining the shape of the GUV, which indicates protein binding. Next, Laurdan was added to the chamber (final concentration of 0.76 µM) and the same target GUV was imaged (image E) revealing the heterogeneities existing on the membrane (total counts increased 10 times with respect to image D). Figure F corresponds to the overlapping of images D and E showing that binding of the protein does not correlate with the membrane heterogeneities. No changes in the size of the GUV occurred at this temperature after adding apoA-I. Experiments were performed in a two photon microscope previously described [68, 70]. For both probes (Alexa-488 and Laurdan) excitation wavelength of 780 nm was used and the fluorescence emission was observed through a broad band-pass filter from 350 to 600 nm (BG39 filter, Chroma Technology, Brattleboro, VT). Blue-red color scale is used for Laurdan intensity images and red for Alexa 488.
Figure 3
Figure 3
Scheme of the different interactions of lipid-free ApoA-I with membranes analyzed by our technical approach: [A] Lipid-free apoA-I interaction with homogeneous phospholipid bilayers results in high binding but non efficient lipid removal [70]. [B] Efficient lipid solubilization occurs from bilayers having high interfacial packing defects, with small fluid domains nucleated within a continuous gel phase [68]. In the diagram the blue ribbon represents the lipid-free apoA-I, circles with two legs represent the phospholipids in disordered state (white) and ordered state (gray),
Figure 4
Figure 4
Kinetics of cholesterol removal by particles of 96Å of wild type apoA-I rHDL (circles) [69] and of the mutant H1@H4 (squares) at 36.5°C from POPC-30% cholesterol GUVs. Solid line for the opened circles symbols corresponds to a first order exponential decay fit with a time constant of 39.3+/−0.1. GP images of the GUV at the beginning (top left) and end (bottom right) of the incubation time are also shown and colored according to the GP scale going from −1 to 1.
Figure 5
Figure 5. Interaction of rHDL with phase co-existing GUV
[A] Diagram of the target GUV attached to the Pt wire, [B] GP image of the target GUV (top view) of DOPC:DPPC:FC (1:1:1 molar ratio) at 24.8°C presenting lo (orange) and ld (light green) separated phases, a small GUV on the top right can also be seen on the top right and the discontinuity on the right shows the place of attachment of the GUV to the platinum wire. For GP measurements, a GP image is taken on the center of the same target GUV and the GP values for each phase are showing in the figure at time zero [C] and after 60 minutes incubation with 10ug/ml 96Å rHDL [D] [69]. False color representation according to the palette with GP values going from −1 to 1 is used.
Figure 6
Figure 6
Scheme of the interaction of lipid-bound apoA-I (rHDL) with membranes analyzed by our technical approach [A] rHDL interact with, and solubilize phospholipids and cholesterol from homogeneous bilayers as independent units and growing in size according to FCS measurements insert reference. [B] If cholesterol is distributed in two phases with different packing (lo/ld), rHDL preferentially remove phospholipids and cholesterol from the more disordered (ld) domain [69]. As in Figure 3, circles with two legs represent the phospholipids in disordered state (white) and ordered state (gray). Black elliptical shape with one leg represents the cholesterol molecules.
Figure 7
Figure 7. GP imaging in alive cells
Top panel: Human red blood cells were labeled with 1 uM Laurdan for 15 minutes and imaged at 37°C. [A] Laurdan spectral image corresponding to the overlapping of 19 images taken simultaneously at different emission wavelength while exciting Laurdan at 780 nm (taken in a Zeiss Meta 710). [B] Normalized emission spectrum of Laurdan in the erythrocyte membrane taken from the area encircled in red in image A. Bottom panel: Using SimFCS, the pixels in the GP image can be separated in those located inside the cells (low GP) and the ones corresponding to the plasma membrane (high GP). Analysis for Human erythrocytes [C, D and E] and Hela cells [F, G and D] are presented.
Figure 8
Figure 8. Effect of cholesterol acceptors on the GP membrane of alive cells
[A] GP membrane values for human erythrocytes in buffer (Control), incubated with MβCD 3.5mM for 120 min, and incubated with 96Å rHDL 300 µg/ml for 2h. Buffer used: 10mM Phosphate, 147 mM NaCl, 3 mM KCl, pH 7.4. [B] GP membrane values for HeLa cells in culture media (Control), incubated with MβCD 10 mM for 60 min and incubated with 96Å rHDL 300µg/ml for 2h. Temperature for all the experiments was 37°C and N corresponds to the number of cells analyzed. ANOVA test was performed to compare the control data and the data after incubation with the cholesterol acceptors. Results show a significant difference with p<0.05. Images presented correspond to the complete GP image. Palette shows the color scale used for all the images.

Similar articles

Cited by

References

    1. Hao M, Mukherjee S, Maxfield FR. PNAS. 2001;98:13072–13077. - PMC - PubMed
    1. Simons K, Ikonen E. Nature. 1997;387:569–572. - PubMed
    1. Lichtenberg D, Goñi FM, Heerklotz H. Trends Biochem. Sci. 2005;30:430–436. - PubMed
    1. Silva LC, Futerman AH, Prieto M. Biophys. J. 2009;96:3210–3222. - PMC - PubMed
    1. Jacobson K, Mouritsen OG, Anderson RGW. Nat. Cell Biol. 2007;9:7–14. - PubMed

Publication types

MeSH terms