

Multivariate models of inter-subject anatomical variability
- PMID: 20347998
- PMCID: PMC3084454
- DOI: 10.1016/j.neuroimage.2010.03.059
Multivariate models of inter-subject anatomical variability
Abstract
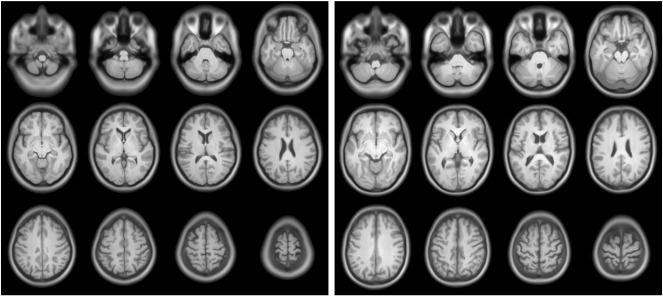
This paper presents a very selective review of some of the approaches for multivariate modelling of inter-subject variability among brain images. It focusses on applying probabilistic kernel-based pattern recognition approaches to pre-processed anatomical MRI, with the aim of most accurately modelling the difference between populations of subjects. Some of the principles underlying the pattern recognition approaches of Gaussian process classification and regression are briefly described, although the reader is advised to look elsewhere for full implementational details. Kernel pattern recognition methods require matrices that encode the degree of similarity between the images of each pair of subjects. This review focusses on similarity measures derived from the relative shapes of the subjects' brains. Pre-processing is viewed as generative modelling of anatomical variability, and there is a special emphasis on the diffeomorphic image registration framework, which provides a very parsimonious representation of relative shapes. Although the review is largely methodological, excessive mathematical notation is avoided as far as possible, as the paper attempts to convey a more intuitive understanding of various concepts. The paper should be of interest to readers wishing to apply pattern recognition methods to MRI data, with the aim of clinical diagnosis or biomarker development. It also tries to explain that the best models are those that most accurately predict, so similar approaches should also be relevant to basic science. Knowledge of some basic linear algebra and probability theory should make the review easier to follow, although it may still have something to offer to those readers whose mathematics may be more limited.
Copyright © 2010 Elsevier Inc. All rights reserved.
Figures
Similar articles
-
Unsupervised learning of probabilistic diffeomorphic registration for images and surfaces.Med Image Anal. 2019 Oct;57:226-236. doi: 10.1016/j.media.2019.07.006. Epub 2019 Jul 12. Med Image Anal. 2019. PMID: 31351389
-
Segmentation of neonatal brain MR images using patch-driven level sets.Neuroimage. 2014 Jan 1;84:141-58. doi: 10.1016/j.neuroimage.2013.08.008. Epub 2013 Aug 19. Neuroimage. 2014. PMID: 23968736 Free PMC article.
-
Evaluation of MRI and cannabinoid type 1 receptor PET templates constructed using DARTEL for spatial normalization of rat brains.Med Phys. 2015 Dec;42(12):6875-84. doi: 10.1118/1.4934825. Med Phys. 2015. PMID: 26632044
-
Computational anatomy with the SPM software.Magn Reson Imaging. 2009 Oct;27(8):1163-74. doi: 10.1016/j.mri.2009.01.006. Epub 2009 Feb 27. Magn Reson Imaging. 2009. PMID: 19249168 Review.
-
The role of pattern recognition in creative problem solving: a case study in search of new mathematics for biology.Prog Biophys Mol Biol. 2013 Sep;113(1):181-215. doi: 10.1016/j.pbiomolbio.2013.03.017. Epub 2013 Apr 15. Prog Biophys Mol Biol. 2013. PMID: 23597605 Review.
Cited by
-
Harnessing Semi-Supervised Machine Learning to Automatically Predict Bioactivities of Per- and Polyfluoroalkyl Substances (PFASs).Environ Sci Technol Lett. 2022 Aug 26;10(11):1017-1022. doi: 10.1021/acs.estlett.2c00530. eCollection 2023 Nov 14. Environ Sci Technol Lett. 2022. PMID: 38025956 Free PMC article.
-
Diffeomorphic registration using geodesic shooting and Gauss-Newton optimisation.Neuroimage. 2011 Apr 1;55(3):954-67. doi: 10.1016/j.neuroimage.2010.12.049. Epub 2011 Jan 7. Neuroimage. 2011. PMID: 21216294 Free PMC article.
-
Medial Prefrontal Aberrations in Major Depressive Disorder Revealed by Cytoarchitectonically Informed Voxel-Based Morphometry.Am J Psychiatry. 2016 Mar 1;173(3):291-8. doi: 10.1176/appi.ajp.2015.15030349. Epub 2015 Dec 1. Am J Psychiatry. 2016. PMID: 26621569 Free PMC article.
-
Individualized Gaussian process-based prediction and detection of local and global gray matter abnormalities in elderly subjects.Neuroimage. 2014 Aug 15;97:333-48. doi: 10.1016/j.neuroimage.2014.04.018. Epub 2014 Apr 15. Neuroimage. 2014. PMID: 24742919 Free PMC article.
-
Finding imaging patterns of structural covariance via Non-Negative Matrix Factorization.Neuroimage. 2015 Mar;108:1-16. doi: 10.1016/j.neuroimage.2014.11.045. Epub 2014 Dec 12. Neuroimage. 2015. PMID: 25497684 Free PMC article.
References
-
- Adams D.C., Rohlf F.J., Slice D.E. Geometric morphometrics: ten years of progress following the revolution. Ital. J. Zool. 2004;710(1):5–16.
-
- Alexander D., Gee J., Bajcsy R. Proceedings of the IEEE Computer Society Conference on Computer Vision and Pattern Recognition, volume 1. 1999. Elastic matching of diffusion tensor MRIs; pp. 244–249.
-
- Allassonnière S., Amit Y., Trouvé A. Towards a coherent statistical framework for dense deformable template estimation. J. R. Stat. Soc. B Methodol. 2007;690(1):3–29.
-
- Amari S.I., Nagaoka H. AMS Bookstore; 2007. Methods of Information Geometry.
-
- Ashburner J. A fast diffeomorphic image registration algorithm. Neuroimage. 2007;380(1):95–113. - PubMed
Publication types
MeSH terms
Grants and funding
LinkOut - more resources
Full Text Sources
