Critical roles of lysosomal acid lipase in myelopoiesis
- PMID: 20348241
- PMCID: PMC2861104
- DOI: 10.2353/ajpath.2010.091063
Critical roles of lysosomal acid lipase in myelopoiesis
Abstract
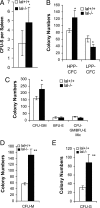
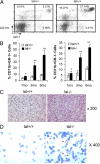
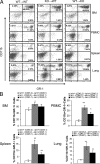
Lysosomal acid lipase (LAL) is a key enzyme that cleaves cholesteryl esters and triglycerides to generate free fatty acids and cholesterol in lysosomes. Genetic ablation of the lal gene (lal(-/-)) in mice has resulted in a systemic increase of macrophages and neutrophils, causing severe inflammation and pathogenesis in multiple organs. We hypothesized that aberrant growth and differentiation of myeloid cells in lal(-/-) mice arises from dysregulated production of progenitor cells in the bone marrow. Indeed, lal(-/-) mice displayed increased numbers of primitive lin(-)Sca-1(+)c-Kit(+) (LSK) cells and granulocyte-macrophage precursors (GMP). Increased high proliferative potential colony-forming cells (HPP-CFC) were enumerated from cultured lal(-/-) bone marrow cells, as were significantly more CFU-GM, CFU-G, and CFU-M colonies. As a consequence, lal(-/-) mice developed significant myeloid infiltration, particularly with CD11b+/Gr-1+ myeloid-derived suppressive cells in multiple organs. Both decreased apoptosis and increased proliferation contribute to the systemic increase of myeloid cells in lal(-/-) myeloid cells. These lal(-/-) CD11b(+)/Gr-1(+) cells displayed suppressive activity on T cell proliferation and function in vitro. Bone marrow chimeras confirmed that the myeloproliferative disorder in lal(-/-) mice was primarily attributable to autonomous defects in myeloid progenitor cells, although the hematopoietic microenvironment in the lal(-/-) mice did not support hematopoiesis normally. These results provide evidence that LAL is an important regulator of myelopoiesis during hematopoietic development, differentiation, and homeostasis.
Figures


Similar articles
-
Myeloid-specific expression of human lysosomal acid lipase corrects malformation and malfunction of myeloid-derived suppressor cells in lal-/- mice.J Immunol. 2011 Oct 1;187(7):3854-66. doi: 10.4049/jimmunol.1003358. Epub 2011 Sep 7. J Immunol. 2011. PMID: 21900179 Free PMC article.
-
Critical role of the mTOR pathway in development and function of myeloid-derived suppressor cells in lal-/- mice.Am J Pathol. 2014 Feb;184(2):397-408. doi: 10.1016/j.ajpath.2013.10.015. Epub 2013 Nov 26. Am J Pathol. 2014. PMID: 24287405 Free PMC article.
-
Critical roles of lysosomal acid lipase in T cell development and function.Am J Pathol. 2009 Mar;174(3):944-56. doi: 10.2353/ajpath.2009.080562. Epub 2009 Jan 29. Am J Pathol. 2009. PMID: 19179613 Free PMC article.
-
Regulation of myelopoiesis.Comp Immunol Microbiol Infect Dis. 1987;10(2):79-91. doi: 10.1016/0147-9571(87)90001-4. Comp Immunol Microbiol Infect Dis. 1987. PMID: 3304823 Review.
-
Lysosomal acid lipase deficiency allograft recurrence and liver failure- clinical outcomes of 18 liver transplantation patients.Mol Genet Metab. 2018 May;124(1):11-19. doi: 10.1016/j.ymgme.2018.03.010. Epub 2018 Mar 27. Mol Genet Metab. 2018. PMID: 29655841 Review.
Cited by
-
Signal transducer and activator of transcription 3 (Stat3C) promotes myeloid-derived suppressor cell expansion and immune suppression during lung tumorigenesis.Am J Pathol. 2011 Oct;179(4):2131-41. doi: 10.1016/j.ajpath.2011.06.028. Epub 2011 Aug 22. Am J Pathol. 2011. PMID: 21864492 Free PMC article.
-
Rab7 GTPase controls lipid metabolic signaling in myeloid-derived suppressor cells.Oncotarget. 2017 May 2;8(18):30123-30137. doi: 10.18632/oncotarget.16280. Oncotarget. 2017. PMID: 28415797 Free PMC article.
-
Fat for fuel: lipid metabolism in haematopoiesis.Clin Transl Immunology. 2019 Dec 24;8(12):e1098. doi: 10.1002/cti2.1098. eCollection 2019. Clin Transl Immunology. 2019. PMID: 31890207 Free PMC article. Review.
-
Activation of mTOR pathway in myeloid-derived suppressor cells stimulates cancer cell proliferation and metastasis in lal(-/-) mice.Oncogene. 2015 Apr 9;34(15):1938-48. doi: 10.1038/onc.2014.143. Epub 2014 Jun 2. Oncogene. 2015. PMID: 24882582 Free PMC article.
-
Hepatocyte-Specific Expression of Human Lysosome Acid Lipase Corrects Liver Inflammation and Tumor Metastasis in lal(-/-) Mice.Am J Pathol. 2015 Sep;185(9):2379-89. doi: 10.1016/j.ajpath.2015.05.021. Epub 2015 Jul 26. Am J Pathol. 2015. PMID: 26212911 Free PMC article.
References
-
- Blank U, Karlsson G, Karlsson S. Signaling pathways governing stem-cell fate. Blood. 2008;111:492–503. - PubMed
-
- Lian X, Yan C, Yang L, Xu Y, Du H. Lysosomal acid lipase deficiency causes respiratory inflammation and destruction in the lung. Am J Physiol Lung Cell Mol Physiol. 2004;286:L801–L807. - PubMed
-
- Du H, Heur M, Duanmu M, Grabowski GA, Hui DY, Witte DP, Mishra J. Lysosomal acid lipase-deficient mice: depletion of white and brown fat, severe hepatosplenomegaly, and shortened life span. J Lipid Res. 2001;42:489–500. - PubMed
-
- Du H, Duanmu M, Witte D, Grabowski GA. Targeted disruption of the mouse lysosomal acid lipase gene: long-term survival with massive cholesteryl ester and triglyceride storage. Hum Mol Genet. 1998;7:1347–1354. - PubMed
Publication types
MeSH terms
Substances
Grants and funding
LinkOut - more resources
Full Text Sources
Other Literature Sources
Molecular Biology Databases
Research Materials

