

Spatially resolved characterization of water and ion incorporation in Bacillus spores
- PMID: 20348293
- PMCID: PMC2869133
- DOI: 10.1128/AEM.02485-09
Spatially resolved characterization of water and ion incorporation in Bacillus spores
Abstract
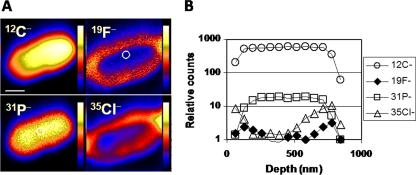
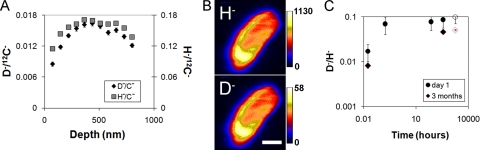
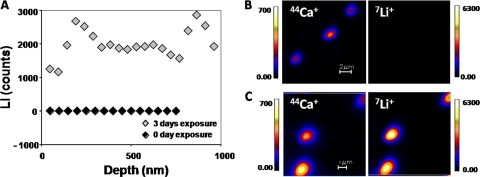
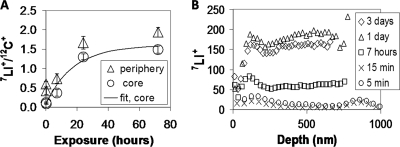
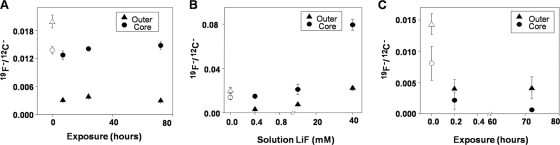
We present the first direct visualization and quantification of water and ion uptake into the core of individual dormant Bacillus thuringiensis subsp. israelensis (B. thuringiensis subsp. israelensis) endospores. Isotopic and elemental gradients in the B. thuringiensis subsp. israelensis spores show the permeation and incorporation of deuterium in deuterated water (D(2)O) and solvated ions throughout individual spores, including the spore core. Under hydrated conditions, incorporation into a spore occurs on a time scale of minutes, with subsequent uptake of the permeating species continuing over a period of days. The distribution of available adsorption sites is shown to vary with the permeating species. Adsorption sites for Li(+), Cs(+), and Cl(-) are more abundant within the spore outer structures (exosporium, coat, and cortex) relative to the core, while F(-) adsorption sites are more abundant in the core. The results presented here demonstrate that elemental abundance and distribution in dormant spores are influenced by the ambient environment. As such, this study highlights the importance of understanding how microbial elemental and isotopic signatures can be altered postproduction, including during sample preparation for analysis, and therefore, this study is immediately relevant to the use of elemental and isotopic markers in environmental microbiology and microbial forensics.
Figures
Similar articles
-
Relationship of the syntheses of spore coat protein and parasporal crystal protein in Bacillus thuringiensis.J Bacteriol. 1982 Jul;151(1):399-410. doi: 10.1128/jb.151.1.399-410.1982. J Bacteriol. 1982. PMID: 7085565 Free PMC article.
-
The high-resolution architecture and structural dynamics of Bacillus spores.Biophys J. 2005 Jan;88(1):603-8. doi: 10.1529/biophysj.104.049312. Epub 2004 Oct 22. Biophys J. 2005. PMID: 15501940 Free PMC article.
-
Persistence and recycling of bioinsecticidal Bacillus thuringiensis subsp. israelensis spores in contrasting environments: evidence from field monitoring and laboratory experiments.Microb Ecol. 2014 Apr;67(3):576-86. doi: 10.1007/s00248-013-0360-7. Epub 2014 Jan 9. Microb Ecol. 2014. PMID: 24402370
-
The Exosporium Layer of Bacterial Spores: a Connection to the Environment and the Infected Host.Microbiol Mol Biol Rev. 2015 Dec;79(4):437-57. doi: 10.1128/MMBR.00050-15. Microbiol Mol Biol Rev. 2015. PMID: 26512126 Free PMC article. Review.
-
Sporulation environment influences spore properties in Bacillus: evidence and insights on underlying molecular and physiological mechanisms.FEMS Microbiol Rev. 2018 Sep 1;42(5):614-626. doi: 10.1093/femsre/fuy021. FEMS Microbiol Rev. 2018. PMID: 29788151 Review.
Cited by
-
Nanomechanical Characterization of Bacillus anthracis Spores by Atomic Force Microscopy.Appl Environ Microbiol. 2016 May 2;82(10):2988-2999. doi: 10.1128/AEM.00431-16. Print 2016 May 15. Appl Environ Microbiol. 2016. PMID: 26969703 Free PMC article.
-
Fighting Ebola with novel spore decontamination technologies for the military.Front Microbiol. 2015 Aug 12;6:663. doi: 10.3389/fmicb.2015.00663. eCollection 2015. Front Microbiol. 2015. PMID: 26322021 Free PMC article.
-
Bacterial imaging and photodynamic inactivation using zinc(II)-dipicolylamine BODIPY conjugates.Photochem Photobiol Sci. 2015 Jul;14(7):1271-81. doi: 10.1039/c5pp00100e. Photochem Photobiol Sci. 2015. PMID: 26063101 Free PMC article.
-
Analysis of metabolism in dormant spores of Bacillus species by 31P nuclear magnetic resonance analysis of low-molecular-weight compounds.J Bacteriol. 2015 Mar;197(5):992-1001. doi: 10.1128/JB.02520-14. Epub 2014 Dec 29. J Bacteriol. 2015. PMID: 25548246 Free PMC article.
-
Imaging and therapeutic applications of zinc(ii)-dipicolylamine molecular probes for anionic biomembranes.Chem Commun (Camb). 2016 Jul 7;52(57):8787-801. doi: 10.1039/c6cc03669d. Chem Commun (Camb). 2016. PMID: 27302091 Free PMC article. Review.
References
-
- Avery, S. V. 1995. Cesium accumulation by microorganisms: uptake mechanisms, cation competition, compartmentalization and toxicity. J. Ind. Microbiol. 14:76-84. - PubMed
-
- Bhattacharjee, Y., and M. Enserink. 2008. Anthrax investigation: FBI discusses microbial forensics—but key questions remain unanswered. Science 321:1026-1027. - PubMed
Publication types
MeSH terms
Substances
LinkOut - more resources
Full Text Sources
Other Literature Sources
Research Materials
